wp-statistics / pchart
此包已被废弃且不再维护。没有建议的替代包。
构建图表的PHP类
1.2.3
2022-11-14 13:06 UTC
Requires
- php: >=5.4.0
README
构建图表的PHP类
pChart是一个面向创建别名图表的PHP类库框架。大多数今天的图表库都需要付费,我们的项目旨在免费提供。数据可以来自SQL查询、CSV文件或手动提供。此项目仍在开发中,每周都会添加新功能或修复。
由于pChart的主要作者自2014年1月19日起未更新,且一些功能已经过时,我们决定更新此库。
安装
首选的安装方式是通过composer。
运行以下命令到您的composer.json文件的require部分:
composer require wp-statistics/pchart
使用方法
在返回[]之前,将以下内容添加到主-local配置文件中:
<?php
require_once __DIR__ . '/../vendor/autoload.php'; // Autoload files using Composer autoload

use pChart\pData;
use pChart\pChart;
use pChart\pCache;

// Dataset definition
$DataSet = new pData;
$DataSet->AddPoint(array(1, 4, 3, 2, 3, 3, 2, 1, 0, 7, 4, 3, 2, 3, 3, 5, 1, 0, 7));
$DataSet->AddSerie();
$DataSet->SetSerieName("Sample data", "Serie1");

// Initialise the graph
$Test = new pChart(700, 230);
$Test->setFontProperties("Fonts/tahoma.ttf", 10);
$Test->setGraphArea(40, 30, 680, 200);
$Test->drawGraphArea(252, 252, 252, TRUE);
$Test->drawScale($DataSet->GetData(), $DataSet->GetDataDescription(), SCALE_NORMAL, 150, 150, 150, TRUE, 0, 2);
$Test->drawGrid(4, TRUE, 230, 230, 230, 70);

// Draw the line graph
$Test->drawLineGraph($DataSet->GetData(), $DataSet->GetDataDescription());
$Test->drawPlotGraph($DataSet->GetData(), $DataSet->GetDataDescription(), 3, 2, 255, 255, 255);

// Finish the graph
$Test->setFontProperties("Fonts/tahoma.ttf", 8);
$Test->drawLegend(45, 35, $DataSet->GetDataDescription(), 255, 255, 255);
$Test->setFontProperties("Fonts/tahoma.ttf", 10);
$Test->drawTitle(60, 22, "My pretty graph", 50, 50, 50, 585);
$Test->Render("Naked.png");
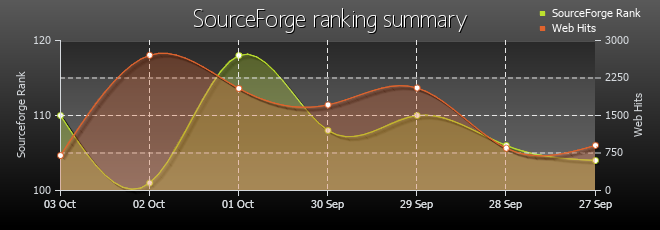
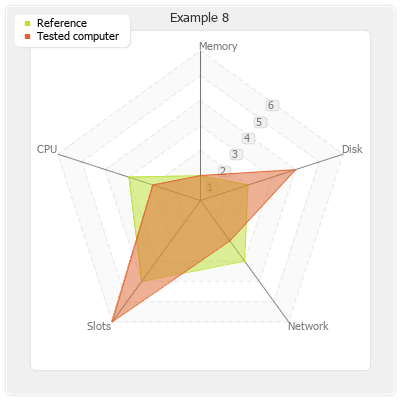
屏幕截图
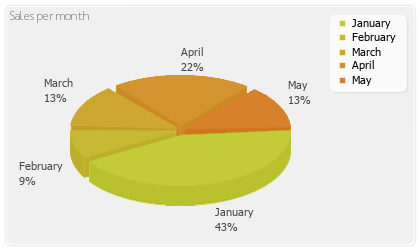
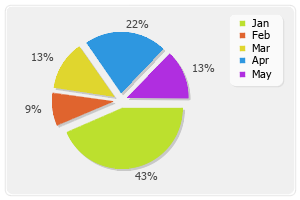
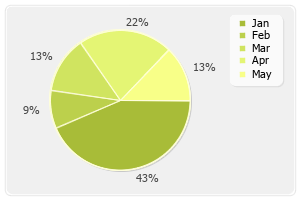
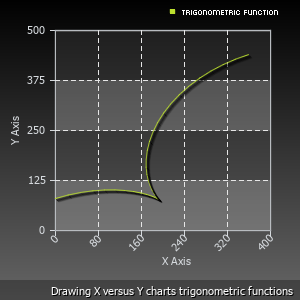
The pChart charting library is providing many ways to reprensent a single or multiple series of data. We'll try to add screenshots everytime an interesting functionnality is added to the pChart library. 