soandso / continental-index
计算大陆性指数的库 - 一种表征大陆性气候的数值特征
0.3.1
2022-04-15 15:16 UTC
Requires
- php: ^7.4
Requires (Dev)
- dealer-teamwork/codacy-coverage: dev-master
- mikey179/vfsstream: 2.0.x-dev
- mockery/mockery: ^1.5
- phpunit/php-code-coverage: 9.2.x-dev
- phpunit/phpunit: 9.5.x-dev
README
大陆性指数
PHP库,用于计算大陆性指数 - 一种表征大陆性气候的数值特征。
要求
此库只要求PHP >= 7.4
设置
将库添加到项目中的composer.json文件
{
  "require": {
      "soandso/continental-index": "0.*"
  }
}
使用composer安装库
$ php composer.phar install
Composer将在您的vendor文件夹中安装synop decoder库。然后您可以将以下内容添加到您的.php文件中,以便使用自动加载来使用库。
require_once(__DIR__ . '/vendor/autoload.php');
您也可以在命令行上使用composer来要求并安装分组
$ php composer.phar require soandso/continental-index
用法
使用初始化数据实例化Register类。
require_once dirname(__FILE__) . '/vendor/autoload.php';

use Soandso\ContinentalIndex\Register;

$report = new Register($inputType, $source, $inputTempUnits, $outputTempUnits, $latitude);

$inputType - Supported types of source data:
Register::FILE
Register::ARRAY
Register::JSON

$source - Input source:
1. File (Show file path)
Source data structure:
Year, space, temperature amplitude value
Example:
2022 78.5

2. array:
[
  Year, temperature amplitude value
]
Example:
[
  [2017, 80.9],
  [2018, 70.3],
  ............
]

3. json:
This format is an array (see above) encoded into a json string

$inputTempUnits - Input temperature amplitude units:
Register::FAHRENHEIT
Register::CELSIUS

$outputTempUnits - Output temperature amplitude units:
Register::FAHRENHEIT
Register::CELSIUS

$latitude - Location latitude
要获取大陆性指数的计算结果,请使用getIndex方法
$index->getIndex(string $title, string $format, string $filePath = null);

$title - Type index of continentality
The following methods for calculating the continentality index are supported:

1. Hromov continentality index - Register::HROMOV_INDEX
2. Gorchinsky continentality index - Register::GORCHINSKY_INDEX
3. Conrad continentality index - Register::CONRAD_INDEX
4. Zenker continentality index - Register::ZENKER_INDEX


$format - Output format
Register::FILE
Register::ARRAY
Register::JSON

$filePath - The path to the directory for extracting the results file
绘图
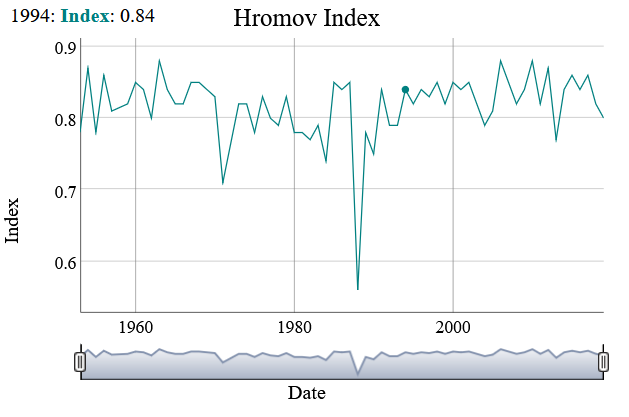
您可以为给定位置构建大陆性指数随时间变化的折线图。为此,您需要使用Register类的plot()方法,并传入使用getIndex(如上所述)获取的计算数据。
php Register::plot($indexAssets)
plot方法还接受第二个可选参数,用于指定绘图选项。
php Register::plot($indexAssets, $options)
$options = [
/** Show or hide the range selector widget (Only for Dygraph provider) **/
'showRangeSelector'      => null, //true or false
/** Height, in pixels, of the range selector widget (Only for Dygraph provider) **/
'rangeSelectorHeight'    => null, //int
/** Width, in pixels, of the chart **/
'width'                  => null, //int
/** Height, in pixels, of the chart **/
'height'                 => null, //int
'title'                  => 'Continental index',
/** Text to display to the left of the chart's y-axis **/
'ylabel'                 => 'Index', //string
/** Text to display below the chart's x-axis **/
'xlabel'                 => 'Date', //string
];
示例用法
指数计算
$index = new Register(Register::FILE, __DIR__ . '/amplitude.txt', Register::FAHRENHEIT, Register::CELSIUS, 45.5);
$indexAssets = $index->getIndex(Register::HROMOV_INDEX, Register::FILE, __DIR__);
绘图
Register::plot($indexAssets);
指定自定义图形选项
Register::plot($indexAssets, [
        'showRangeSelector' => true,
        'rangeSelectorHeight' => 30,
        'title' => 'Hromov Index',
]);
致谢
Dygraphs - 开源JavaScript图表库。(https://dygraphs.com)
标准
大陆性指数符合以下标准
- PSR-2 - 基本编码标准 (https://www.php-fig.org/psr/psr-2/)
- PSR-4 - 自动加载 (https://www.php-fig.org/psr/psr-4/)
- PSR-12 - 扩展编码风格指南 (https://www.php-fig.org/psr/psr-12/)
许可证
Grouping采用GPLv2许可证(https://gnu.ac.cn/licenses/old-licenses/gpl-2.0.html)。

