marzzelo / graph
小型笛卡尔图形生成器
Requires
- php: >=8.0
- intervention/image: ^2.5
Requires (Dev)
- orchestra/testbench: ^8.0
- phpunit/phpunit: ^9.5
README
Marzzelo/Graph 是一个简单的 PHP Cartesian Graph 创建库,支持 Laravel。
特性
安装
使用 Composer 从 Packagist 安装 Graph
composer require marzzelo/graph
基本用法
- 以如下形式定义要绘制的数据集
$data = [[x0,y0], [x1,y1], ...]
protected function getTestData(): array
{
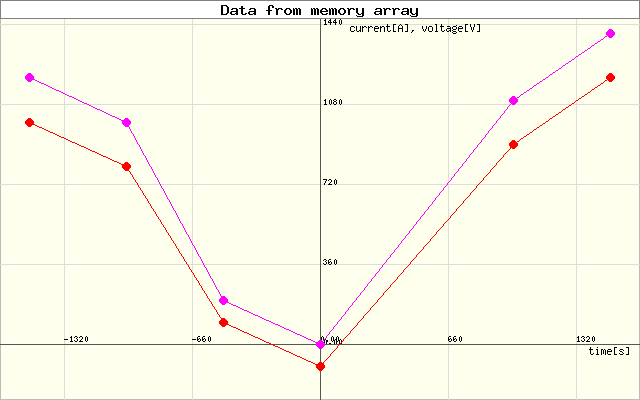
    $data1 = [[-1500, 1000], [-1000, 800], [-500, 100], [0, -100], [1000, 900], [1500, 1200]];
    $data2 = [[-1500, 1200], [-1000, 1000], [-500, 200], [0, 0], [1000, 1100], [1500, 1400]];
    ...
    $dataN = [...];
    return [$data1, $data2, ... $dataN];
}
您可以定义自己的数据格式,实现 IDataSet 接口。以下是一个示例。
在基本用法中,您可以使用 Graph 门面调用 fromArray 或 fromCSV 方法
use Marzzelo\Graph\Facades\Graph;

$data = $this->getTestData();
$graph = Graph::fromArray($data);
最后,您可以使用 save 方法将图形保存到文件,或使用 render64 方法获取图像内容作为 base64 字符串
// to render:
$img64 = $graph->render64('png');
// view: <img src="{{ $graph }}" alt='' />
// to save to disk:
$graph->save('graph/testgraph.png');
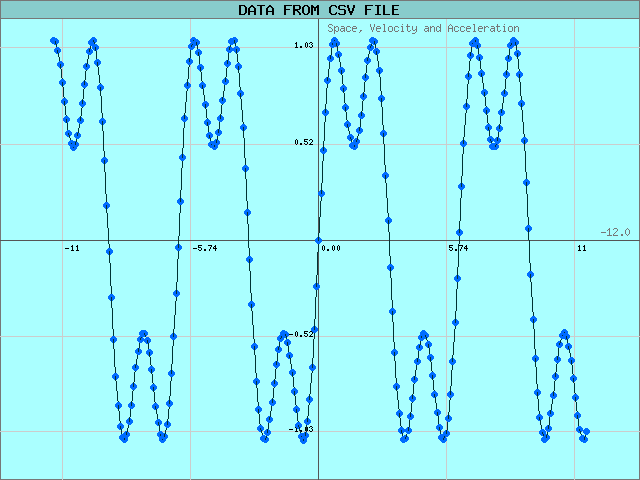
使用 fromCSV 方法,您可以从 CSV 文件创建图形
$graph = Graph::fromCSV('data.csv');
CSV 文件必须在第一行包含列名,以下行包含数据。第一列必须包含自变量,以下列必须包含因变量。分隔符字符可以在 $options 数组中指定(默认为逗号)
$graph = Graph::fromCSV('data.csv', ['separator' => ',']);
还可以将许多配置选项传递给 fromArray 和 fromCSV 方法
$options = [
    'frame' => [
        'width-px'         => 640,
        'height-px'        => 480,
        'background-color' => '#FFF',
        'frame-color'      => '#777',
    ],

    'axis' => [
        'grid-size-xy'           => [null, null], // in physical units
        'labels'                 => [null, null], // axis labels
        'margin'                 => 20, // can be array [x, y] or int
        'title'                  => '',
        'title-color'            => null,  // takes a contrasting color from 'background-color'
        'title-background-color' => null,  // takes 'background-color' darken by 20%
        'axis-color'             => '#555', // color of axis lines
        'grid-color'             => '#ddd',
        'labels-color'           => '#777',
    ],

    // array of dataset settings, one for each dataset.
    // if not specified, the default values are used.
    'datasets' => [[
        'line-color'    => '#00A',
        'marker-radius' => 0,
        'marker-color'  => '#00A',
    ]],

    'csv'  => [
        'delimiter' => ',',
        'skip'      => 0,  // number of lines to skip
    ],
];
Laravel 支持
如果您未指定 'datasets' 选项,则使用默认值。默认值可以自定义,发布配置文件
php artisan vendor:publish --provider="Marzzelo\Graph\GraphServiceProvider" --tag="config"
或者,省略参数并从列表中选择配置文件
php artisan vendor:publish
发布的配置文件位于 config/graph.php。
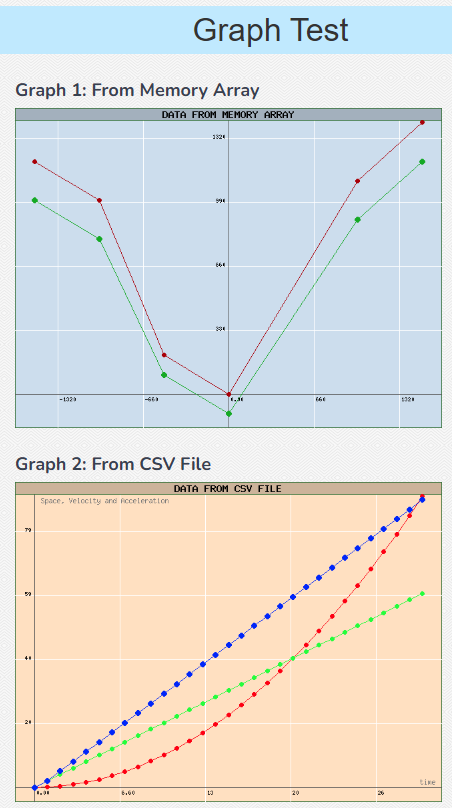
已实现一个到测试页面的路由,因此您可以使用简单的网页测试库。默认路由为 /graph-test,页面如下所示: 
php artisan vendor:publish --provider="Marzzelo\Graph\GraphServiceProvider" --tag="marzzelo:graph-config"
您也可以更改路由,发布配置文件并编辑 route 参数。
您还可以自定义视图,发布视图文件
php artisan vendor:publish --provider="Marzzelo\Graph\GraphServiceProvider" --tag="marzzelo:graph-views"
发布的视图文件位于 resources/views/vendor/graph/graph-test.blade.php。
您还可以自定义用于生成测试图形的数据集,发布资产文件
php artisan vendor:publish --provider="Marzzelo\Graph\GraphServiceProvider" --tag="marzzelo:graph-assets"
发布的资产文件位于 public/vendor/graph/assets。
消息和错误为英文和西班牙语。您可以自定义消息,发布语言文件
php artisan vendor:publish --provider="Marzzelo\Graph\GraphServiceProvider" --tag="marzzelo:graph-translations"
发布的语言文件位于 resources/lang/vendor/graph。
高级用法
使用选项,您可以自定义图形外观
$graph = Graph::fromCSV('data.csv', $options);
使用自定义数据格式、轴和框架
- 使用 DataSet 类创建数据集。可选地,您可以定义 标记半径 和 线条颜色。
$dataset1 = new DataSet($data1, 6, '#070');
$dataset2 = new DataSet($data2, 8, '#600');
...
$datasetN = new DataSet($dataN, 8, '#600');
- 使用类 Frame 定义一个用于绘制图形的画布。输入宽度、高度,可选地输入背景颜色和边框颜色。
$frame = new Frame(640, 400, '#FFF', '#bbb');
- 为图形定义一个 轴(本例中使用了 AutoAxis 具体类)。您可以选择以下轴实现或创建自己的轴
- AutoAxis 需要所有数据集按顺序传入以自动计算轴界限。
- BasicAxis 具体类只需要左上角和右下角的点。
$axis = (new AutoAxis([$dataset1, $dataset2,... $datasetN], $frame ))
// Add labels to the Axis (optional)
        ->addLabels('time[s]', 'current[A], voltage[V]')
// Set grid spacing in physical units (optional)
        ->setGrid(200, 100);
- 基于轴定义图形
$graph = (new Graph($axis))
         ->addDataSets([
             $dataset1,
             $dataset2,
         ])
// Get the image to display (render64)
        ->render64('png');

// Or, save the image to a file
$graph->render()->save('graph/testgraph.png');
然后,您可以使用 $img64 内容作为 <img> html 标签的 图像源
<div class=''>
    <img src="{{$graph}}" alt='' class='mx-auto' />
</div>
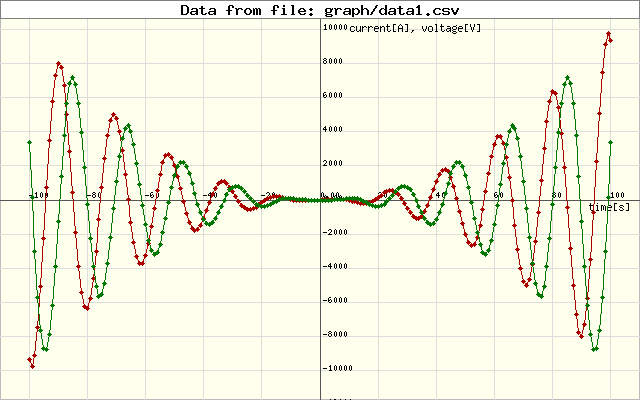
情况 2:来自 CSV 文件的数据集
- 从 CSV 文件(逗号分隔值)可以创建一个 CsvFileReader 对象。文件的第一个必须包含列名。以下行必须以以下形式包含数据:
t, I, V,其中t是自变量,而I和V是因变量。文件必须在脚本所在的目录或子目录中。文件名必须作为参数传递给构造函数。第二个参数是分隔符字符(默认为逗号)。
$csvFile = new CsvFileReader('data.csv', ",");  // create the CSV file reader
$datasets = $csvFile->getDataSets(); // get the data sets

$datasets[0]->setMarker(5, '#a00'); // set marker radius and color
$datasets[1]->setMarker(5, '#070');

$frame = new Frame(640, 400);  // create the frame
$axis = (new AutoAxis($datasets, $frame ))  // create the axis
    ->addLabels('time[s]', 'current[A], voltage[V]')
    ->setGrid(200, 100);
    ->addTitle('Current and voltage vs time');

(new Graph($axis))
	->addDataSets($datasets) // add the datasets to the graph
	->render()->save('graph/testgraph.png');  // save the graph to a file
Laravel 支持
安装
无需安装任何东西。自动发现已启用。
用法
要创建 Frame,请使用 Frame 门面
$frame = Frame::make(640, 400, '#FFF', '#bbb'); // create the frame
您也可以使用 Graph 门面获取 Frame 实例
$frame = Graph::Frame(640, 400, '#FFF', '#bbb'); // create the frame
要创建数据集,请使用 DataSet 门面,或 Graph 门面
$data1 = [[-1500, 1000], [-1000, 800], [-500, 100], [0, -100], [1000, 900], [1500, 1200]];
$data2 = [[-1500, 1200], [-1000, 1000], [-500, 200], [0, 0], [1000, 1100], [1500, 1400]];

$dataset1 = Graph::DataSet($data1, 8, '#F00'); // create the dataset
$dataset2 = Graph::DataSet($data2, 8, '#F0F');
或者,使用 Graph 门面从 CSV 文件获取数据
$csvFile = Graph::CsvFileReader($source, $sep);  // create the CSV file reader
$datasets = $csvFile->getDataSets(); // get the data sets
这同样适用于轴和图形门面
$axis = Graph::AutoAxis([$dataset1, $dataset2], $frame, [5, 10]) // Create the axis and set the grid spacing
	->addLabels(['time[s]', 'current[A], voltage[V]']) // Add labels to the axis
	->setGrid($gridx, $gridy) // Set the grid spacing
	->addTitle($title); // Add a title to the graph
最后,要创建图形,请使用 Graph 门面
 Graph::make($axis)  // Create the graph
    ->setDataSets($this->datasets)  // Add the datasets
    ->render()->save($destination);  // Save the graph to a file
贡献
欢迎提交拉取请求。对于重大更改,请先打开一个问题来讨论您希望更改的内容。
请确保适当地更新测试。


