communia / check_drupal_8
此nagios插件将检查您的Drupal网站是否存在问题(安全更新、更新[可选]、待处理的数据库更新、其他问题)。
README
Nagios Drupal插件,用于监控Drupal网站的状态和/或Drupal多站点,检查安全更新、系统更新、核心错误、核心警告和缺失的数据库迁移。
![]()
![]()
测试于
- Drupal 8
概述
<!---

详细信息
 --->
--->
注意
此检查可以以两种方式使用
- 让nagios始终触发
check_drupal_8,可能需要1-3秒,并造成一些负载 - 让nagios简单地解析由
check_drupal_8在目标机器上通过cron创建的日志文件(使用check_drupal_log)。
我建议第二种选择,因为您不需要每5分钟检查每个Drupal网站,并且为了保持nagios检查尽可能快,建议使用cron在目标机器上大约每6小时触发一次 check_drupal_8。
要求
| 程序 | 必需 | 描述 |
|---|---|---|
| bourne shell (sh) | yes | 整个脚本是用纯bourne shell (sh) 编写的,并且100%符合Posix标准 |
| check_by_ssh 或 NRPE | yes | check_by_ssh用作检查远程主机的包装器。或者,您可以使用NRPE,如这里所述: 问题 #2 |
| drush 10 | yes | 此nagios插件需要在目标机器上安装drush |
| jq | yes | 轻量级且灵活的命令行JSON处理器 |
| composer | yes | PHP的依赖管理器 |
特性
- 多站点支持
- 检查Drupal安全更新
- 检查Drupal系统更新
- 检查Drupal必需的数据库迁移
- 检查Drupal核心错误
- 检查Drupal核心警告
- 每个检查可以指定自己的nagios严重性(错误或警告)
- 为nagios短输出自定义名称
- 能够不显示通过drush锁定的更新
- nagios长输出中的详细信息
- 能够成功识别有效的Drupal6或Drupal7文档根目录
- 基本性能数据流:OK、错误、警告和未知数量的数量
1. 使用方法
1.1 check_drupal_8
使用 -l,您可以在每台机器上仅运行几次 check_drupal_8 并将输出写入日志文件。然后可以通过调用 check_drupal_log 来检查此文件,这只会读取日志而不会对机器造成任何负载。每个服务器上每个Drupal网站都可以有多个日志文件。
Usage: check_drupal_8 -d <drupal root> -c <project root> [-n <name>] [-s <w|e>] [-p <w|e>][-u <w|e>] [-w <w|e|c>] [-m <w|e>] [-i <uri>] [-l <log file>] [-t]
OR     check_drupal_8 --help
OR     check_drupal_8 --version

Nagios plugin that will check drupal sites for errors.
Errors include the following: available security updates,
missed database migrations and drupal status errors.
For each check you can specify the nagios severity (error or warning).
For drupal status requirements can be used -w c option to automatically find
aggregated status based on the status of each check in the site status report.

  -d <drupal root>       The full path to the drupal document root (usually
                         the 'drupal' folder. This parameter is required.

  -c <project root>      The full path to the drupal project composer root (usually
                         the 'drupal-suggested' folder. This parameter is required.

  -n <name>              [optional] Specify a name for the drupal instance to
                         appear on the nagios output. The default is 'Drupal'

  -x <drush path>        [optional] Specify the path to drush if is not in the
                         {project_root}/vendor/bin/drush path. The default is empty
                         and use {project_root}/vendor/bin/drush

  -s <w|e>               [optional] Check for drupal core, and modules security
                         updates and return nagios error or warning.
                         Warning:  -s w
                         Error:    -s e

  -p <w|e>               [optional] Check for PHP packages security
                         updates and return nagios error or warning.
                         Warning:  -s w
                         Error:    -s e

  -u <w|e>               [optional] Check for drupal core and module updates
                         in general and return nagios error or warning.
                         Warning:  -u w
                         Error:    -u e

  -w <w|e|c>             [optional] Check for drupal system requirements and return
                         nagios error, warning, or automatically pick state from collected data.
                         Warning:  -w w
                         Automatic:  -w c
                         Error:    -w e

  -m <w|e>               [optional] Check for drupal missed database migrations
                         and return nagios error or warning. (They can occur
                         when you update core or modules and forget the db).
                         Warning:  -m w
                         Error:    -m e

  -i <uri>               [optional] Parse in an url for a drupal multisite instance.
                         'drush --uri':
                         In Drupal 7, the value of --uri should always be
                         the same as when the site is being accessed from a web browser
                         (e.g. http://mysite.org, although the http:// is optional).
                         In Drupal 6, the value of --uri should always be the same as the
                         site s folder name in the 'sites' folder (e.g. default); it is best
                         if the site folder name matches the URI from the browser, and is consistent
                         on every instance of the same site
                         (e.g. also use sites/mysite.org for http://dev.mysite.org).

  -l <log file>          [optional] Instead of checking all of the above via nagios
                         every five minutes or so, run this script via cron once a day
                         (or twice) and write the output into a logfile. This logfile can
                         then be checked by the nagios plugin 'check_drupal_log' which is
                         less costy in terms of load/cpu.
                         See 'check_drupal_log --help' for more info.
                         Example:
                         check_drupal -d /var/www -s e -e e -w w -l /var/log/drupal.log
                         check_drupal_log -l /var/log/drupal.log

  -t                     Test for program requirements.
  --help                 Show this help
  --version              Show version information.
1.2 check_drupal_log
Usage: check_drupal_log -f <logfile>
OR     check_drupal_log --help
OR     check_drupal_log --version

Nagios plugin that will parse the logfile created by 'check_drupal'.

  -f <logfile>           The full path to logfile created by 'check_drupal'

  --help                 Show this help
  --version              Show version information.
2. 示例
以下示例直接从命令行运行。退出代码总是汇总的,这意味着如果程序抛出警告和错误,最终退出代码将导致错误。
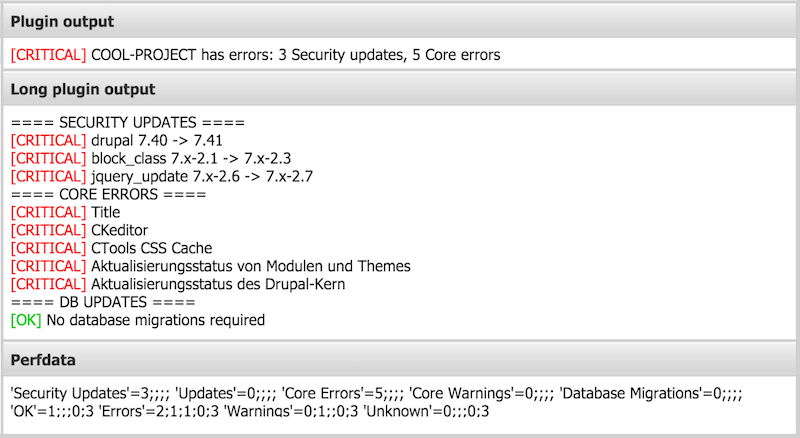
另外要注意:直到 | 的第一行代表实际的nagios输出。第一行中 | 之后的所有内容是用于生成酷炫图表的性能数据。从第二行开始的所有内容是nagios扩展状态信息(当您点击详情时)。
检查安全更新 TODO <!--- `bash ./check_drupal -d /shared/httpd/sites-drupal/COOL-PROJECT/drupal/ -n COOL-PROJECT -s e [CRITICAL] COOL-PROJECT 存在错误:2 个安全更新 | 'Security Updates'=2;;;; 'Updates'=0;;;; 'Core Errors'=0;;;; 'Core Warnings'=0;;;; 'Database Migrations'=0;;;; 'OK'=0;;;0;1 'Errors'=1;1;1;0;1 'Warnings'=0;1;;0;1 'Unknown'=0;;;0;1 ==== 安全更新 ==== [CRITICAL] drupal 7.40 -> 7.41 [CRITICAL] jquery_update 7.x-2.6 -> 7.x-2.7
--->

**Check for security and normal updates**
<!---
./check_drupal -d /shared/httpd/sites-drupal/COOL-PROJECT/drupal/ -n COOL-PROJECT -s e -u w [CRITICAL] COOL-PROJECT 存在错误:3 个安全更新,3 个更新 | 'Security Updates'=3;;;; 'Updates'=3;;;; 'Core Errors'=0;;;; 'Core Warnings'=0;;;; 'Database Migrations'=0;;;; 'OK'=0;;;0;2 'Errors'=1;1;1;0;2 'Warnings'=1;1;;0;2 'Unknown'=0;;;0;2 ==== 安全更新 ==== [CRITICAL] drupal 7.40 -> 7.41 [CRITICAL] block_class 7.x-2.1 -> 7.x-2.3 [CRITICAL] jquery_update 7.x-2.6 -> 7.x-2.7 ==== 系统更新 ==== [WARNING] field_collection 7.x-1.0-beta9 -> 7.x-1.0-beta10 [WARNING] views 7.x-3.11 -> 7.x-3.13 [WARNING] bootstrap 7.x-3.0 -> 7.x-3.4
-->
**Check for all possible stuff**
<!--
./check_drupal -d /shared/httpd/sites-drupal/COOL-PROJECT/drupal/ -n COOL-PROJECT -s e -u w -e e -w c -m e [CRITICAL] COOL-PROJECT 存在错误:3 个安全更新,3 个更新,5 个核心错误,1 个核心警告 | 'Security Updates'=3;;;; 'Updates'=3;;;; 'Core Errors'=5;;;; 'Core Warnings'=1;;;; 'Database Migrations'=0;;;; 'OK'=1;;;0;5 'Errors'=2;1;1;0;5 'Warnings'=2;1;;0;5 'Unknown'=0;;;0;5 ==== 安全更新 ==== [CRITICAL] drupal 7.40 -> 7.41 [CRITICAL] block_class 7.x-2.1 -> 7.x-2.3 [CRITICAL] jquery_update 7.x-2.6 -> 7.x-2.7 ==== 系统更新 ==== [WARNING] field_collection 7.x-1.0-beta9 -> 7.x-1.0-beta10 [WARNING] views 7.x-3.11 -> 7.x-3.13 [WARNING] bootstrap 7.x-3.0 -> 7.x-3.4 ==== 核心错误 ==== [CRITICAL] CKeditor [CRITICAL] Cron-Wartungsaufgaben [CRITICAL] CTools CSS Cache [CRITICAL] 模块和主题更新状态 [CRITICAL] Drupal 核心更新状态 ==== 核心警告 ==== [WARNING] Token ==== 数据库更新 ==== [OK] 无需数据库迁移
-->
**Check for db updates**
<!--
./check_drupal -d /shared/httpd/sites-drupal/COOL-PROJECT/drupal/ -n COOL-PROJECT -m e [OK] COOL-PROJECT 是健康的 | 'Security Updates'=0;;;; 'Updates'=0;;;; 'Core Errors'=0;;;; 'Core Warnings'=0;;;; 'Database Migrations'=0;;;; 'OK'=1;;;0;1 'Errors'=0;1;1;0;1 'Warnings'=0;1;;0;1 'Unknown'=0;;;0;1 ==== 数据库更新 ==== [OK] 无需数据库迁移
-->
## 3. Nagios Configuration

### 3.1 check_drupal

#### Command definition
In order to check drupal sites on remote servers you will need to make use of `check_by_ssh`.
名称:check_by_ssh_drupal 命令:$USER1$/check_by_ssh -H $HOSTADDRESS$ -t 60 -l "$USER17$" -C "$USER22$/check_drupal -d $ARG1$ -n $ARG2$ $ARG3$"
#### Service definition
In the above command definition there are two fixed arguments for the document root and the project name as well as one loose argument place holder that can hold all checks you want to run. The following shows one example service definition for one specific drupal site:
检查命令:ssh_drupal_cool-drupal-project $ARG1$: /var/www/cool-drupal-project/drupal/ $ARG2$: Cool Drupal Project $ARG3$: -s e -u w -e e -w c -m e
The above service definition will check against security updates (with nagios error), against normal updates (with nagios warning), against core errors (with nagios error), against core warnings (with nagios warning) and finally against missed database migrations (with nagios error).

### 3.2 check_drupal_log

#### Command definition
In order to check drupal sites on remote servers you will need to make use of `check_by_ssh`.
名称:check_by_ssh_drupal 命令:$USER1$/check_by_ssh -H $HOSTADDRESS$ -t 60 -l "$USER17$" -C "$USER22$/check_drupal_log -f $ARG1$"
#### Service definition
In the above command definition there is only one argument. This will point to the logfile created by `check_drupal`:
检查命令:ssh_drupal_cool-drupal-project $ARG1$: /var/log/drupal_cool-project.log
#### Cron setup
For this recommended setup to work you need to setup a cronjob on the target machine (where the drupal site is installed) that is run every 6 hours, every day or whatever you want.

Setup multiple cronjobs with multiple logfiles if you have multiple drupal sites on this machine that you want to monitor.
0 /6 * * /path/to/check_drupal_8 -d /var/www/cool-drupal-project/drupal/ -n "Cool Project" -s e -u w -e e -w c -m e -l /var/log/drupal_cool-project.log
## 4. Icinga2 Configuration

### 4.1 check_drupal

#### Command definition
Because icinga2 should be running on every monitored server, there is no need for `check_by_ssh`.
对象 CheckCommand "check_drupal" {
import "plugin-check-command"

command = [ PluginDir + "/check_drupal_8" ]

arguments = {
	"-d" = "$drupal_root$"
	"-n" = "$name$"
	"-s" = "$s$"
	"-u" = "$u$"
	"-e" = "$e$"
	"-w" = "$w$"
	"-m" = "$m$"
}
}
#### Service definition
The following shows an example service definition for one specific drupal site:
应用服务 "check_cool-drupal-project" {
import "generic-service"

check_command = "check_drupal"

vars.drupal_root = "/var/www/cool-drupal-project/drupal/"
vars.name = "Cool Drupal Project"
vars.s = "e"
vars.u = "w"
vars.e = "e"
vars.w = "c"
vars.m = "e"

assign where host.name == NodeName
}
The above service definition will check against security updates (with nagios error), against normal updates (with nagios warning), against core errors (with nagios error), against core warnings (with nagios warning) and finally against missed database migrations (with nagios error).

### 4.2 check_drupal_log

#### Command definition
对象 CheckCommand "check_drupal_log" {
import "plugin-check-command"

command = [ PluginDir + "/check_drupal_log" ]

arguments = {
	"-f" = "$logfile$"
}
}
#### Service definition
In the above command definition there is only one argument. This will point to the logfile created by `check_drupal`:
为(logfile => config in host.vars.logfile)应用服务 {
import "generic-service"

check_command = "check_drupal_log"

vars += config
}
The above service definition will look for multiple "vars.logfile" in your `host.conf`:
vars.logfile["drupal name1"] = { logfile = "/var/log/check_drupal/name1.log" } vars.logfile["drupal name2"] = { logfile = "/var/log/check_drupal/name2.log" } vars.logfile["drupal name3"] = { logfile = "/var/log/check_drupal/name3.log" }
#### Cron setup
For this recommended setup to work you need to setup a cronjob on the target machine (where the drupal site is installed) that is run every 6 hours, every day or whatever you want.

Setup multiple cronjobs with multiple logfiles if you have multiple drupal sites on this machine that you want to monitor.
0 /6 * * /path/to/check_drupal_8 -d /var/www/cool-drupal-project/drupal/ -n "Cool Project" -s e -u w -e e -w w -m e -l /var/log/drupal_cool-project.log
## 5. Performance data
Screenshots taken from an [Icinga](https://www.icinga.org/) setup
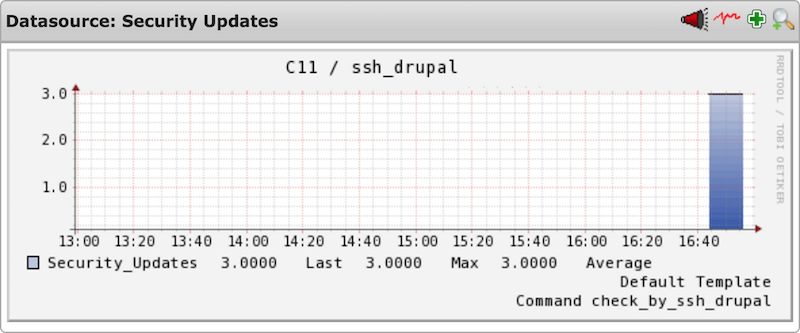
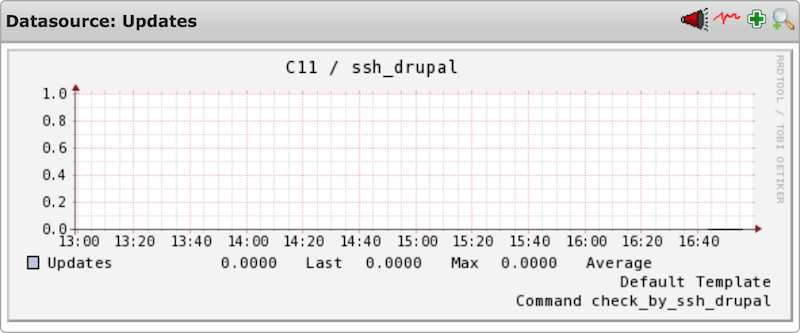
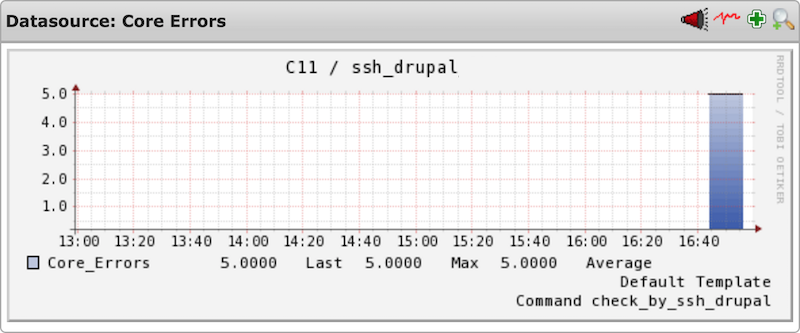
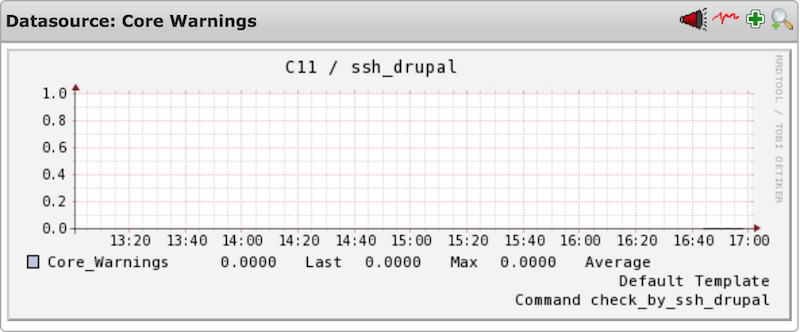
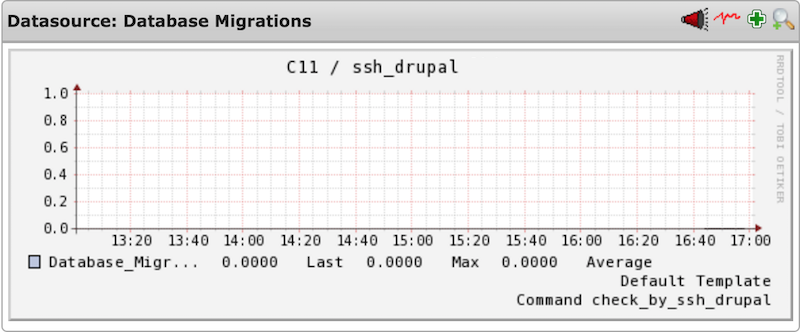
### 5.1 Specific data
The following performance data gives detailed information about specific errors/warnings that have occured
<!---
--->
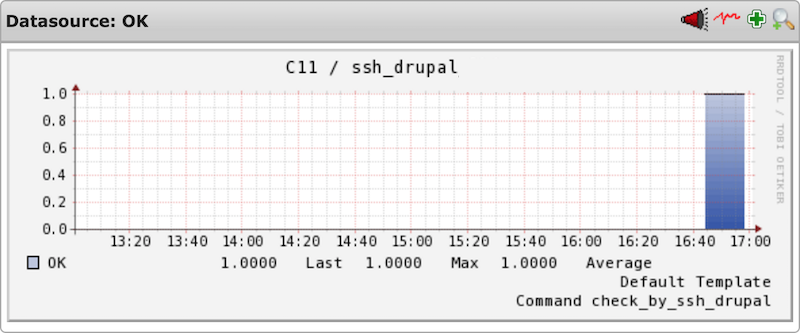
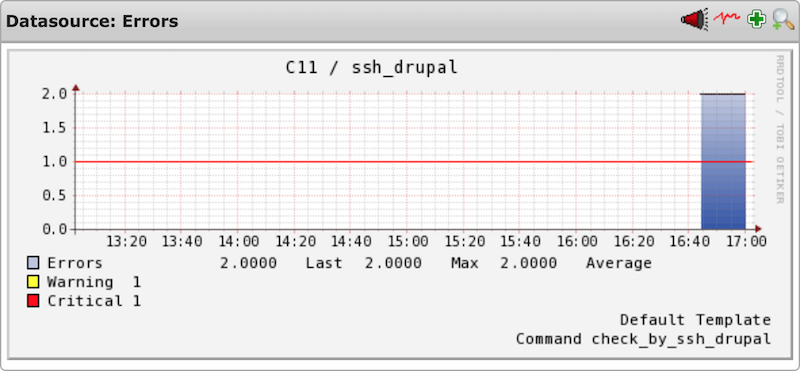
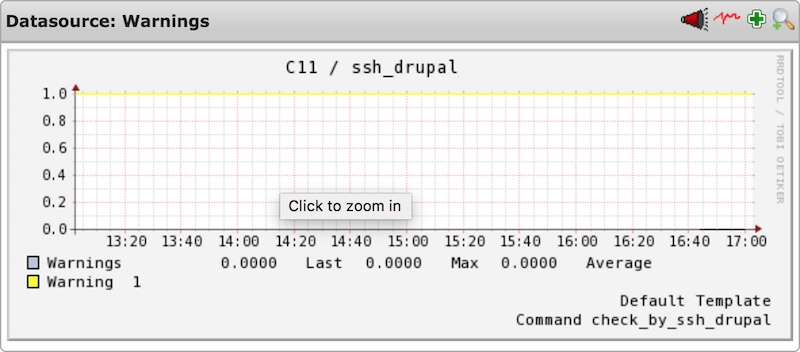
### 5.2 General data
The following performance data gives a general overview about how many OK's, Errors, Warnings and Unknowns have happened over time. This way you can also see how quickly the reaction time has been to occured problems.
**Best practise:**
* OK: should always be a high vertical line
* Error: Should only have short peaks
* Warning: Should only have short peaks
* Unknown: Should never happen
<!---

--->
## 6. License
[](https://open-source.org.cn/licenses/mit)