通过  搜索
搜索
phpanonymous / c3js
C3JS 由 phpanonymous (Mahmoud Ibrahim) 提供
0.0.10
2023-09-10 11:06 UTC
This package is auto-updated.
Last update: 2024-09-10 13:19:36 UTC
README
c3js 图表和图形 - 通过 C3js 简单地制作图表,由 PHPanonymous (Mahmoud Ibrahim) 提供 #免费包,用于创建您的 KPI 和图表
安装
composer require phpanonymous/c3js
发布提供者
php artisan vendor:publish --provider="Phpanonymous\C3JS\C3JSProvider" 或者
php artisan vendor:publish 并选择您的列表中的 c3js 包编号
使用
在您的头部提供此内容,确保使用 jQuery 库 {!! C3js::c3jAsset() !!}
小部件
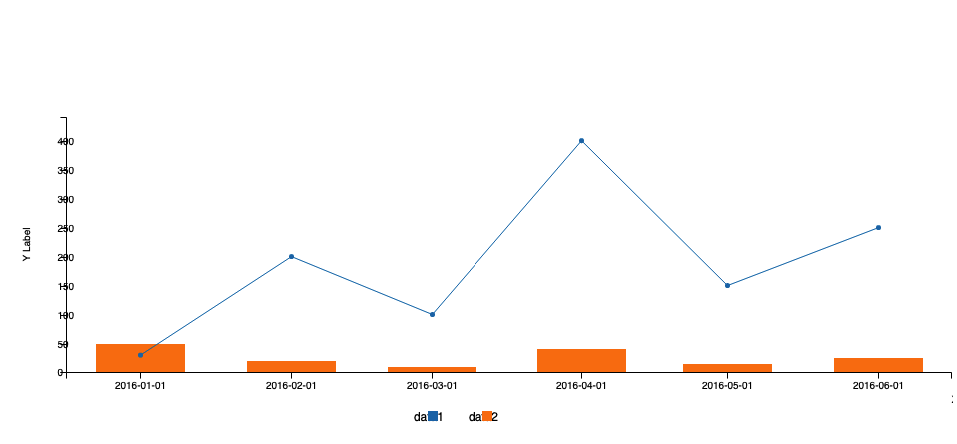
此示例展示了如何制作您的第一个图表
使用 C3js::widget 静态函数
use Phpanonymous\C3JS\C3js;
$chart_1 = C3js::widget([
'bindto'   => "#chartJs",
'data'     => [
	'x'       => 'x',
	'columns' => [
		['x', '2016-01-01', '2016-02-01', '2016-03-01', '2016-04-01', '2016-05-01', '2016-06-01'],
		['data1', 30, 200, 100, 400, 150, 250],
		['data2', 50, 20, 10, 40, 15, 25],
	],
	'types'  => [
		'data1' => 'bar',
		'data2' => 'bar',
	],
],

'axis'        => [
	'y'          => [
		'label'     => [
			'text'     => 'Y Label',
			'position' => 'outer-middle',
		],
	],
	'x'        => [
		'type'    => 'timeseries',
		'tick'    => [
			'format' => '%Y-%m-%d',
		],
		'label'     => [
			'text'     => 'X Label',
			'position' => 'outer-middle',
		],
	],
],

]);
此包基于 c3js 库
这是一个演示包,目前处于 beta 版本,尚未发布。我们很快将发布版本 1