mpociot / cockpit
Requires
- php: >=5.3.0
- illuminate/support: ~5.0
- khill/lavacharts: ~2.5
Requires (Dev)
- mockery/mockery: dev-master
- orchestra/testbench: ~3.0
- phpunit/phpunit: 4.7.*
This package is auto-updated.
Last update: 2024-08-24 10:55:27 UTC
README
为您的 Laravel 应用添加自定义小部件

带有自定义指标、过滤器和支持拖放操作的易用小部件。
注意:文档仍在进行中。
内容
## InstallationIn order to install Cockpit, just add
"mpociot/cockpit": "~1.0" to your composer.json. Then run composer install or composer update.
(or run composer require mpociot/cockpit if you prefere that)
Then in your config/app.php add
Mpociot\Cockpit\CockpitServiceProvider::class in the providers array.
Next, publish Cockpit's views, javascript files and migration and run the migrate command.
php artisan vendor:publish --provider="Mpociot\Cockpit\CockpitServiceProvider" php artisan migrate ## Usage After you've published all the needed assets and created the widgets table through the Cockpit migration, you're good to go.
Cockpit comes with some preconfigured routes, so go ahead and visit: http://your.app/cockpit/.
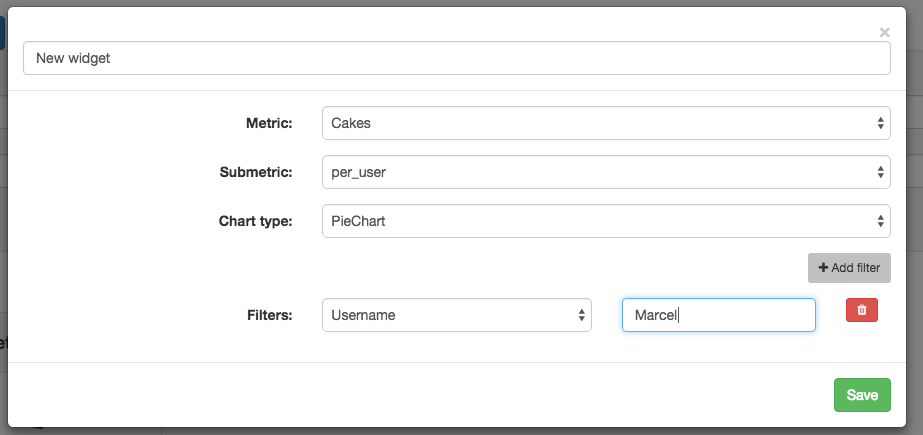
This is your "dashboard" which allows you to create custom widgets that will query your application and show some nice charts.
### How does it work?When you add a new widget, Cockpit will look in a configurable folder for all available metrics your app could define. Each metric can have multiple sub-metrics that can be queried and those sub-metrics are filterable.
Example to make the concept easier to understand:
Your app logs all logins. On your dashboard, you want to be able to show a widget that displays:
- All logins grouped by "time" (this could be day, week, month, year)
- All logins grouped by specific users
In this case, your metric would be Logins that has two submetrics named per_time and per_user.
Cockpit ships a simple Users metric, which will be copied to this directory: app/Cockpit/Metrics. If your app is running in a different namespace or you want to change the path of your custom metrics, modify the appropriate values in the config/cockpit.php file.
The base structure of a metric is:
use Mpociot\Cockpit\Metric; class Logins extends Metric { // Visible name when selecting the metric in the UI protected $name = "My Metric"; // Define all submetrics and which charts are available for each submetric protected $allowedSubMetrics = [ 'per_user' => ['LineChart','ColumnChart','PieChart'], ]; // Define all filters that can be applied to this metric protected $allowedFilters = [ 'username' => [ 'type' => 'text', 'name' => 'Username' ] ]; /** * Implement date filter functionality. * This is needed for all metrics, as the time filter is always available */ protected function filterFromDate($query, $value) { return $query->where("created_at" , ">", $value); } protected function filterUntilDate($query, $value) { return $query->where("created_at" , "<=", $value); } /** * Implement your custom submetrics */ public function calculatePerUser($filters = []) { // Use this Eloquent model for all queries $query = \App\Models\Login::query(); // Apply each filter method on the query object $query = $this->applyFilters($query, $filters); // Get the results we need to display $results = $query ->groupBy("username") ->get([ DB::raw('username, COUNT(*) AS `count`') ]); // Define the columns our chart will have $this->dataTable ->addStringColumn("Username") ->addNumberColumn("Num Logins"); // Add the database results to our chart foreach ($results as $result) { $this->dataTable->addRow([ $result->username, $result->count ]); } return $this->dataTable; } /** * Implement your custom filters */ protected function filterUsername($query, $value) { return $query->where("username",$value); } }### Custom filters
Not documented yet :(
### Available chart types- Line Chart
- Area Chart
- Bar Chart
- Column Chart
- Pie Chart
- Donut Chart
- Geo Chart
- Calendar Chart
- Gauge Chart
有关 DataTable API / 图表 API 的工作方式的更多信息,请参阅 Lavacharts。
## 许可证cockpit 是在 MIT 许可证下免费分发的软件。