martinsik / google-chart-generator
使用 Polymer 1.0 <google-chart> 元素的 PHP 5.4+ 的 Google Chart API 包装器
Requires
- php: >=5.4
Requires (Dev)
- behat/behat: 2.4.*@stable
- phpunit/phpunit: 4.6.*
This package is not auto-updated.
Last update: 2024-09-14 17:37:23 UTC
README
PHP 5.4+ 的 Google Chart API 包装器,基于 Polymer 1.0 组件 <google-chart>。
安装
添加 composer.json 依赖
"require": {
    "martinsik/google-chart-generator": "^2.0.0"
}
添加 bower.json 依赖(Polymer 1.0)
"dependencies": {
    "google-chart": "GoogleWebComponents/google-chart#^1.0.0"
}
最终,根据需要安装 google-chart Polymer 组件 (查看安装说明)。
图表
PHP 包装器非常灵活,允许您通过数据或图表选项设置任何 Google Chart 选项。因为它有很多选项,所以没有必要为每个选项创建包装器。
要使用任何图表,您必须首先导入 Polymer 1.0 元素和 WebComponents polyfill
<!-- Polyfill Web Components support for older browsers -->
<script src="/bower_components/webcomponentsjs/webcomponents.min.js"></script>

<!-- Import element -->
<link rel="import" href="/bower_components/google-chart/google-chart.html">
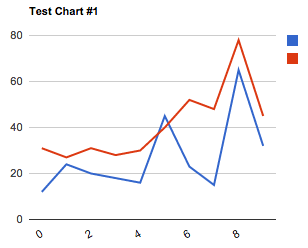
折线图
创建折线图
$chart = new LineChart(['title' => 'Test Chart #1']);
$chart->addData(new SequenceData([12, 24, 20, 18, 16, 45, 23, 15, 65, 32], ['label' => 'Line #1']));
$chart->addData(new SequenceData([31, 27, 31, 28, 30, 40, 52, 48, 78, 45], ['label' => 'Line #2']));
使用 $chart->getElement() 获取元素 HTML。
<google-chart style=""
    type='line'
    options='{"title":"Test Chart #1"}'
    cols='[{"type":"string"},{"type":"number","label":"Line #1"},{"type":"number","label":"Line #2"}]'
    rows='[["0",12,31],["1",24,27],["2",20,31],["3",18,28],["4",16,30],["5",45,40],["6",23,52],["7",15,48],["8",65,78],["9",32,45]]'>
</google-chart>
查看 折线图 的所有可能选项。
上述代码将生成以下图表。
饼图
创建饼图
$chart = new PieChart(['width' => '150px', 'height' => '150px', 'pieHole' => 0.5]);
$chart->addData([new SingleData(40, 'Arc #1'), new SingleData(60, 'Arc #2'), new SingleData(80, 'Arc #3')]);
使用 $chart->getElement() 获取元素 HTML。
<google-chart style="width:150px;height:150px;"
    type='pie'
    options='{"pieHole":0.5}'
    cols='[{"type":"string","label":"Title"},{"type":"number","label":"Value"}]'
    rows='[["Arc #1",40],["Arc #2",60],["Arc #3",80]]'>
</google-chart>
查看 饼图 的所有可能选项。
条形图
创建条形图
$chart = new BarChart();
$chart->addData(new SequenceData([20, 40, 30]));
使用 $chart->getElement() 获取元素 HTML。
<google-chart style=""
    type='bar'
    options='[]'
    cols='[{"type":"string"},{"type":"number"}]'
    rows='[["0",20],["1",40],["2",30]]'>
</google-chart>
查看 条形图 的所有可能选项。
柱状图
创建柱状图
$chart = new ColumnChart(['width' => '700px', 'isStacked' => true, 'legend' => ['position' => 'none']]);
$chart->addData(new SequenceData(["a1" => 20, "a2" => 40, "a3" => 30], ['label' => 'aaa']));
$chart->addData(new SequenceData(["a1" => 15, "a2" => 32, "a3" => 34], ['label' => 'bbb']));
$chart->addData(new SequenceData(["a1" => 21, "a2" => 42, "a3" => 17], ['label' => 'ccc']));
使用 $chart->getElement() 获取元素 HTML。
<google-chart style="width:700px;"
    type='bar'
    options='{"isStacked":true,"legend":{"position":"none"}}'
    cols='[{"type":"string"},{"type":"number","label":"aaa"},{"type":"number","label":"bbb"},{"type":"number","label":"ccc"}]'
    rows='[["a1",20,15,21],["a2",40,32,42],["a3",30,34,17]]'>
</google-chart>
查看 柱状图 的所有可能选项。
测试
本项目的所有测试都基于 behat。
$ bin/behat
然后手动检查 features/generated_html 中的生成的图表
许可
Google Chart Generator 根据 MIT 许可证授权。