macocci7 / php-scatterplot
易于使用,用于创建散点图。
Requires
- php: >=8.1
- intervention/image: ^3.7
- macocci7/php-combination: ^1.0
- macocci7/php-csv: ^1.0
- macocci7/php-frequency-table: ^1.3
- nette/neon: ^3.4
Requires (Dev)
- php-parallel-lint/php-parallel-lint: ^1.4
- phpmd/phpmd: ^2.15
- phpstan/phpstan: ^1.11
- phpunit/phpunit: ^10.5
- squizlabs/php_codesniffer: ^3.7
README
1. 功能
PHP-Scatterplot 是一个用于轻松创建散点图的 PHP 库。
您还可以检索解析后的数据
平均值,方差,标准差,协方差,
相关系数 和 回归线公式。
支持 参考线 和 规格限制。
支持 多层数据集。

内容
3. 要求
- PHP 8.1 或更高版本
- Imagick PHP 扩展
- Composer
4. 安装
composer require macocci7/php-scatterplot
5. 使用方法
5.1. 基本用法
-
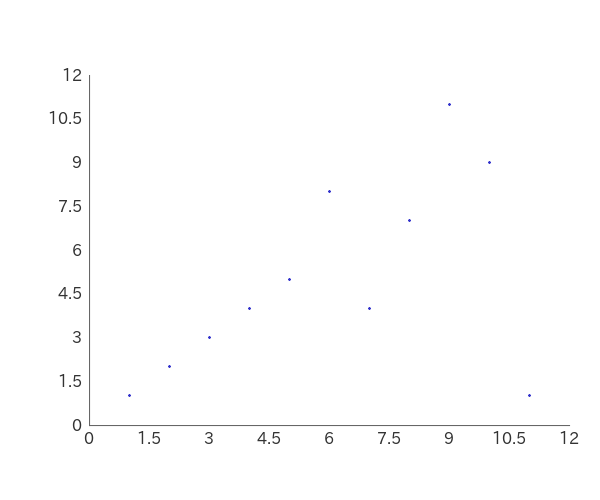
<?php

require_once __DIR__ . '/../vendor/autoload.php';

use Macocci7\PhpScatterplot\Scatterplot;

$layers = [
    [
        'x' => [ 1, 2, 3, 4, 5, 6, 7, 8, 9, 10, 11, ],
        'y' => [ 1, 2, 3, 4, 5, 8, 4, 7, 11, 9, 1, ],
    ],
];

$sp = new Scatterplot();
$sp->layers($layers)
    ->create('img/BasicUsage.png');
-
结果: examples/img/BasicUsage.png
-
详细信息
- 导入自动加载器:
require_once __DIR__ . '/../vendor/autoload.php' - 声明:
use Macocci7\PhpScatterplot - 准备数据:
$layers = [ $layer ]$layers:array<int|string, array<string, list<int|float>>>$layer:array<string, list<int|float>>$layer必须有x和y的哈希键。x和y的哈希数组必须具有相同数量的元素。
- 实例化:
new Scatterplot() - 设置数据:
layers($layers) - 创建图像:
create($path)
- 导入自动加载器:

5.2. 使用图层
-
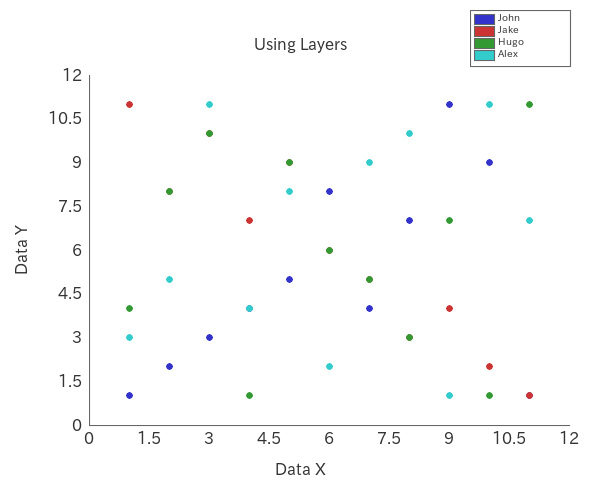
<?php

require_once __DIR__ . '/../vendor/autoload.php';

use Macocci7\PhpScatterplot\Scatterplot;

$layers = [
    'John' => [
        'x' => [ 1, 2, 3, 4, 5, 6, 7, 8, 9, 10, 11, ],
        'y' => [ 1, 2, 3, 4, 5, 8, 4, 7, 11, 9, 1, ],
    ],
    'Jake' => [
        'x' => [ 1, 2, 3, 4, 5, 6, 7, 8, 9, 10, 11, ],
        'y' => [ 11, 8, 10, 7, 9, 6, 5, 3, 4, 2, 1, ],
    ],
    'Hugo' => [
        'x' => [ 1, 2, 3, 4, 5, 6, 7, 8, 9, 10, 11, ],
        'y' => [ 4, 8, 10, 1, 9, 6, 5, 3, 7, 1, 11, ],
    ],
    'Alex' => [
        'x' => [ 1, 2, 3, 4, 5, 6, 7, 8, 9, 10, 11, ],
        'y' => [ 3, 5, 11, 4, 8, 2, 9, 10, 1, 11, 7, ],
    ],
];

$legends = array_keys($layers);

$sp = new Scatterplot();
$sp->layers($layers)
   ->plotSize(6)
   ->legends($legends)
   ->labelX('Data X')
   ->labelY('Data Y')
   ->caption('Using Layers')
   ->create('img/UsingLayers.png');
-
结果: examples/img/UsingLayers.png
-
详细信息
- 更改绘图大小(直径):
plotSize(int $pixSize) - 设置图例标签:
legends(string[] $legends) - 设置 X 轴标签:
labelX(string $labelX) - 设置 Y 轴标签:
labelY(string $labelY) - 设置标题:
caption(string $caption)
- 更改绘图大小(直径):

5.3. 通过方法调整显示
-
PHP: examples/AdjustDisplayByMethods.php
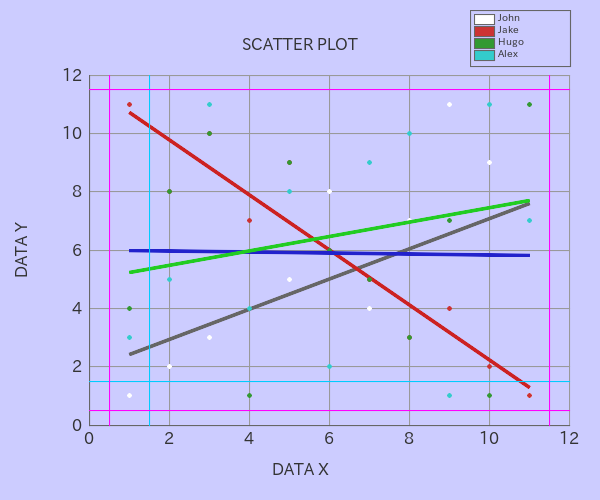
<?php

require_once __DIR__ . '/../vendor/autoload.php';

use Macocci7\PhpScatterplot\Scatterplot;

$layers = [
    'John' => [
        'x' => [ 1, 2, 3, 4, 5, 6, 7, 8, 9, 10, 11, ],
        'y' => [ 1, 2, 3, 4, 5, 8, 4, 7, 11, 9, 1, ],
    ],
    'Jake' => [
        'x' => [ 1, 2, 3, 4, 5, 6, 7, 8, 9, 10, 11, ],
        'y' => [ 11, 8, 10, 7, 9, 6, 5, 3, 4, 2, 1, ],
    ],
    'Hugo' => [
        'x' => [ 1, 2, 3, 4, 5, 6, 7, 8, 9, 10, 11, ],
        'y' => [ 4, 8, 10, 1, 9, 6, 5, 3, 7, 1, 11, ],
    ],
    'Alex' => [
        'x' => [ 1, 2, 3, 4, 5, 6, 7, 8, 9, 10, 11, ],
        'y' => [ 3, 5, 11, 4, 8, 2, 9, 10, 1, 11, 7, ],
    ],
];

$legends = array_keys($layers);

$sp = new Scatterplot();
$sp->layers($layers)
   ->limitX(0, 12)
   ->limitY(0, 12)
   ->gridXPitch(2)
   ->gridYPitch(2)
   ->bgcolor('#ccccff')
   ->colors(['#ffffff'])
   ->plotSize(4)
   ->fontColor('#333333')
   ->grid(1, '#999999')
   ->gridXOn()
   ->gridYOn()
   ->regressionLine(3, [ '#666666', '#cc2222', '#2222cc', '#22cc22', ])
   ->referenceLineX(1.5, 1, '#00ccff')
   ->referenceLineY(1.5, 1, '#00ccff')
   ->specificationLimitX(0.5, 11.5, 1, '#ff00ff')
   ->specificationLimitY(0.5, 11.5, 1, '#ff00ff')
   ->labelX('DATA X')
   ->labelY('DATA Y')
   ->caption('SCATTER PLOT')
   ->legends($legends)
   ->create('img/AdjustDisplayByMethods.png');
-
结果: examples/img/AdjustDisplayByMethods.png
-
详细信息
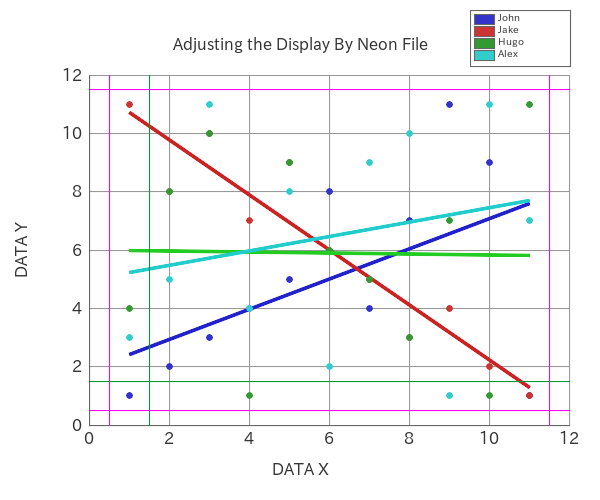
5.4. 通过 Neon 文件调整显示
首先,准备一个类似这样的 Neon 文件
-
Neon: examples/AdjustDisplayByNeon.neon
#canvasWidth: 600
#canvasHeight: 500
canvasBackgroundColor: '#ccccff'
#frameXRatio: 0.8
#frameYRatio: 0.7
#axisColor: '#666666'
#axisWidth: 1
gridColor: '#999999'
#gridWidth: 1
gridXPitch: 2
gridYPitch: 2
gridX: true
gridY: true
xLimitUpper: 12
xLimitLower: 0
yLimitUpper: 12
yLimitLower: 0
plotDiameter: 6
#fontPath: 'fonts/ipaexg.ttf' # IPA ex Gothic 00401
#fontSize: 16
#fontColor: '#333333'
referenceLineX: true
referenceLineXValue: 1.5
referenceLineXWidth: 1
referenceLineXColor: '#009933'
referenceLineY: true
referenceLineYValue: 1.5
referenceLineYWidth: 1
referenceLineYColor: '#009933'
specificationLimitX: true
specificationLimitXLower: 0.5
specificationLimitXUpper: 11.5
specificationLimitXWidth: 1
specificationLimitXColor: '#ff00ff'
specificationLimitY: true
specificationLimitYLower: 0.5
specificationLimitYUpper: 11.5
specificationLimitYWidth: 1
specificationLimitYColor: '#ff00ff'
regressionLine: true
regressionLineWidth: 3
labelX: 'DATA X'
labelY: 'DATA Y'
caption: 'Adjusting the Display By Neon File'
legend: true
legends: [ 'John', 'Jake', 'Hugo', 'Alex', ]
legendWidth: 100
legendFontSize: 10
colors:
    - '#3333cc'
    - '#cc3333'
    - '#339933'
    - '#33cccc'
    - '#cc3333'
    - '#ffcc33'
    - '#cccc33'
    - '#cc33cc'
regressionLineColors:
    - '#2222cc'
    - '#cc2222'
    - '#22cc22'
    - '#22cccc'
其次,编写 PHP 代码如下
-
PHP: examples/AdjustDisplayByNeon.php
<?php

require_once __DIR__ . '/../vendor/autoload.php';

use Macocci7\PhpScatterplot\Scatterplot;

$layers = [
    'John' => [
        'x' => [ 1, 2, 3, 4, 5, 6, 7, 8, 9, 10, 11, ],
        'y' => [ 1, 2, 3, 4, 5, 8, 4, 7, 11, 9, 1, ],
    ],
    'Jake' => [
        'x' => [ 1, 2, 3, 4, 5, 6, 7, 8, 9, 10, 11, ],
        'y' => [ 11, 8, 10, 7, 9, 6, 5, 3, 4, 2, 1, ],
    ],
    'Hugo' => [
        'x' => [ 1, 2, 3, 4, 5, 6, 7, 8, 9, 10, 11, ],
        'y' => [ 4, 8, 10, 1, 9, 6, 5, 3, 7, 1, 11, ],
    ],
    'Alex' => [
        'x' => [ 1, 2, 3, 4, 5, 6, 7, 8, 9, 10, 11, ],
        'y' => [ 3, 5, 11, 4, 8, 2, 9, 10, 1, 11, 7, ],
    ],
];

$sp = new Scatterplot();
$sp->layers($layers)
   ->config('AdjustDisplayByNeon.neon')
   ->create('img/AdjustDisplayByNeon.png');
然后,运行 PHP 代码。

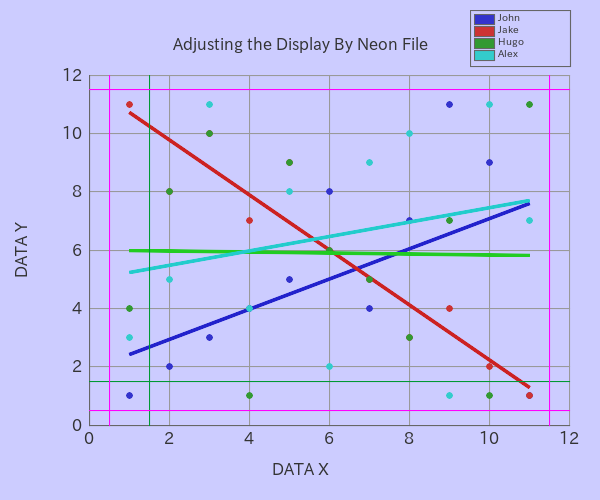
5.5. 通过数组调整显示
-
PHP: examples/AdjustDisplayByArray.php
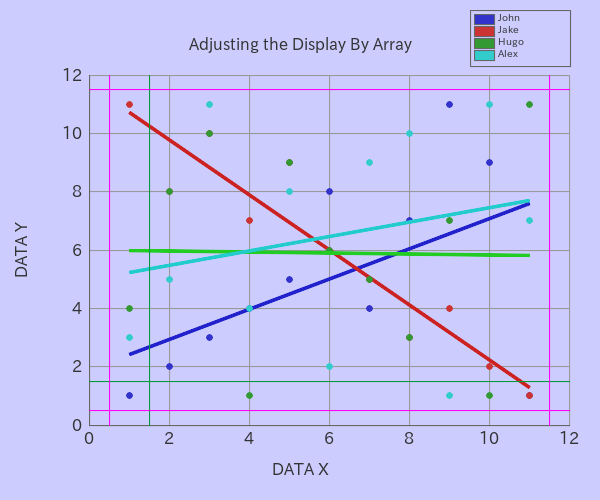
<?php

require_once __DIR__ . '/../vendor/autoload.php';

use Macocci7\PhpScatterplot\Scatterplot;

$layers = [
    'John' => [
        'x' => [ 1, 2, 3, 4, 5, 6, 7, 8, 9, 10, 11, ],
        'y' => [ 1, 2, 3, 4, 5, 8, 4, 7, 11, 9, 1, ],
    ],
    'Jake' => [
        'x' => [ 1, 2, 3, 4, 5, 6, 7, 8, 9, 10, 11, ],
        'y' => [ 11, 8, 10, 7, 9, 6, 5, 3, 4, 2, 1, ],
    ],
    'Hugo' => [
        'x' => [ 1, 2, 3, 4, 5, 6, 7, 8, 9, 10, 11, ],
        'y' => [ 4, 8, 10, 1, 9, 6, 5, 3, 7, 1, 11, ],
    ],
    'Alex' => [
        'x' => [ 1, 2, 3, 4, 5, 6, 7, 8, 9, 10, 11, ],
        'y' => [ 3, 5, 11, 4, 8, 2, 9, 10, 1, 11, 7, ],
    ],
];

$conf = [
    //'canvasWidth' => 600,
    //'canvasHeight' => 500,
    'canvasBackgroundColor' => '#ccccff',
    //'frameXRatio' => 0.8,
    //'frameYRatio' => 0.7,
    //'axisColor' => '#666666',
    //'axisWidth' => 1,
    'gridColor' => '#999999',
    //'gridWidth' => 1,
    'gridXPitch' => 2,
    'gridYPitch' => 2,
    'gridX' => true,
    'gridY' => true,
    'xLimitUpper' => 12,
    'xLimitLower' => 0,
    'yLimitUpper' => 12,
    'yLimitLower' => 0,
    'plotDiameter' => 6,
    //'fontPath' => 'fonts/ipaexg.ttf', // IPA ex Gothic 00401
    //'fontSize' => 16,
    //'fontColor' => '#333333',
    'referenceLineX' => true,
    'referenceLineXValue' => 1.5,
    'referenceLineXWidth' => 1,
    'referenceLineXColor' => '#009933',
    'referenceLineY' => true,
    'referenceLineYValue' => 1.5,
    'referenceLineYWidth' => 1,
    'referenceLineYColor' => '#009933',
    'specificationLimitX' => true,
    'specificationLimitXLower' => 0.5,
    'specificationLimitXUpper' => 11.5,
    'specificationLimitXWidth' => 1,
    'specificationLimitXColor' => '#ff00ff',
    'specificationLimitY' => true,
    'specificationLimitYLower' => 0.5,
    'specificationLimitYUpper' => 11.5,
    'specificationLimitYWidth' => 1,
    'specificationLimitYColor' => '#ff00ff',
    'regressionLine' => true,
    'regressionLineWidth' => 3,
    'labelX' => 'DATA X',
    'labelY' => 'DATA Y',
    'caption' => 'Adjusting the Display By Neon File',
    'legend' => true,
    'legends' => [ 'John', 'Jake', 'Hugo', 'Alex', ],
    'legendWidth' => 100,
    'legendFontSize' => 10,
    'colors' => [
        '#3333cc',
        '#cc3333',
        '#339933',
        '#33cccc',
        '#cc3333',
        '#ffcc33',
        '#cccc33',
        '#cc33cc',
    ],
    'regressionLineColors' => [
        '#2222cc',
        '#cc2222',
        '#22cc22',
        '#22cccc',
    ],
];

$sp = new Scatterplot();
$sp->layers($layers)
   ->config($conf)
   ->create('img/AdjustDisplayByArray.png');
-
结果: examples/img/AdjustDisplayByArray.png

5.6. 透明背景
-
PHP: examples/TransparentBackground.php
<?php

require_once __DIR__ . '/../vendor/autoload.php';

use Macocci7\PhpScatterplot\Scatterplot;

$layers = [
    'John' => [
        'x' => [ 1, 2, 3, 4, 5, 6, 7, 8, 9, 10, 11, ],
        'y' => [ 1, 2, 3, 4, 5, 8, 4, 7, 11, 9, 1, ],
    ],
    'Jake' => [
        'x' => [ 1, 2, 3, 4, 5, 6, 7, 8, 9, 10, 11, ],
        'y' => [ 11, 8, 10, 7, 9, 6, 5, 3, 4, 2, 1, ],
    ],
    'Hugo' => [
        'x' => [ 1, 2, 3, 4, 5, 6, 7, 8, 9, 10, 11, ],
        'y' => [ 4, 8, 10, 1, 9, 6, 5, 3, 7, 1, 11, ],
    ],
    'Alex' => [
        'x' => [ 1, 2, 3, 4, 5, 6, 7, 8, 9, 10, 11, ],
        'y' => [ 3, 5, 11, 4, 8, 2, 9, 10, 1, 11, 7, ],
    ],
];

$sp = new Scatterplot();
$sp->layers($layers)
   ->config('AdjustDisplayByNeon.neon')
   ->config([
       // This results in transparent backgournd
       'canvasBackgroundColor' => null,
   ])
   ->create('img/TransparentBackground.png');
-
结果:examples/img/TransparentBackground.png
5.7. 解析数据
-
<?php

require_once __DIR__ . '/../vendor/autoload.php';

use Macocci7\PhpScatterplot\Analyzer;

$a = new Analyzer();

$layers = [
    'John' => [
        'x' => [1,2,3,4,5,6,7,8,9,10,11],
        'y' => [1,2,3,4,5,8,4,7,11,9,1],
    ],
    'Jake' => [
        'x' => [1,2,3,4,5,6,7,8,9,10,11],
        'y' => [11,8,10,7,9,6,5,3,4,2,1],
    ],
];

var_dump($a->parse($layers));
-
array(2) {
    ["John"]=>
    array(6) {
        ["count"]=>
        int(11)
        ["x"]=>
        array(5) {
            ["Mean"]=>
            int(6)
            ["Max"]=>
            int(11)
            ["Min"]=>
            int(1)
            ["Variance"]=>
            int(10)
            ["StandardDeviation"]=>
            float(3.1622776601683795)
        }
        ["y"]=>
        array(5) {
            ["Mean"]=>
            int(5)
            ["Max"]=>
            int(11)
            ["Min"]=>
            int(1)
            ["Variance"]=>
            float(10.181818181818182)
            ["StandardDeviation"]=>
            float(3.1908961408698624)
        }
        ["Covariance"]=>
        float(5.181818181818182)
        ["CorrelationCoefficient"]=>
        float(0.5135343537364686)
        ["RegressionLineFormula"]=>
        array(2) {
            ["a"]=>
            float(0.5181818181818182)
            ["b"]=>
            float(1.8909090909090907)
        }
    }
    ["Jake"]=>
    array(6) {
        ["count"]=>
        int(11)
        ["x"]=>
        array(5) {
            ["Mean"]=>
            int(6)
            ["Max"]=>
            int(11)
            ["Min"]=>
            int(1)
            ["Variance"]=>
            int(10)
            ["StandardDeviation"]=>
            float(3.1622776601683795)
        }
        ["y"]=>
        array(5) {
            ["Mean"]=>
            int(6)
            ["Max"]=>
            int(11)
            ["Min"]=>
            int(1)
            ["Variance"]=>
            int(10)
            ["StandardDeviation"]=>
            float(3.1622776601683795)
        }
        ["Covariance"]=>
        float(-9.454545454545455)
        ["CorrelationCoefficient"]=>
        float(-0.9454545454545453)
        ["RegressionLineFormula"]=>
        array(2) {
            ["a"]=>
            float(-0.9454545454545455)
            ["b"]=>
            float(11.672727272727274)
        }
    }
}
6. 示例
-
BasicUsage.php >> 结果在 BasicUsage.md
-
UsingLayers.php >> 结果在 UsingLayers.md
-
AdjustDisplayByNeon.php >> 结果在
-
AdjustDisplayByArray.php >> 结果在
-
TransparentBackground.php >> 结果在
-
ParsedData.php >> 结果在 ParsedData.txt
-
Matrix.php >> 结果在 Matrix.md
7. 许可证
文档编写日期:2023/06/06
文档更新日期:2024/04/18
版权所有 2023 - 2024 macocci7。