macocci7 / php-boxplot
创建箱型图简单易用。
Requires
- php: >=8.1
- fakerphp/faker: ^1.23
- macocci7/php-frequency-table: ^1.4
- macocci7/php-plotter2d: ^0.3
- nette/neon: ^3.4
Requires (Dev)
- php-parallel-lint/php-parallel-lint: ^1.4
- phpmd/phpmd: ^2.15
- phpstan/phpstan: ^1.11
- phpunit/phpunit: ^10.5
- squizlabs/php_codesniffer: ^3.7
README
1. 功能
PHP-Boxplot 是一个易于使用的 PHP 库,用于创建箱型图。
可以开启/关闭 Outlier Detection。
支持 Plotting Mean、Plotting Jitter 和 Plotting Outliers。
可以同时显示多个数据集。
也支持显示图例。

支持透明背景。
![]()
内容
3. 要求
- PHP 8.1 或更高版本
- Imagick PHP 扩展
- Composer
4. 安装
composer require macocci7/php-boxplot
5. 使用方法
5.1. 基本用法
-
<?php

require_once __DIR__ . '/../vendor/autoload.php';

use Macocci7\PhpBoxplot\Boxplot;

$data = [
    '1st' => [ 75, 82, 96, 43, 78, 91, 84, 87, 93, ],
    '2nd' => [ 66, 74, 62, 100, 72, 68, 59, 76, 65, ],
    '3rd' => [ 56, 0, 45, 76, 58, 52, 13, 48, 54, 68, ],
    '4th' => [ 68, 32, 56, 92, 67, 72, 45, 76, 48, 73, ],
    '5th' => [ 70, 58, 62, 88, 62, 68, 56, 63, 64, 78, ],
];

$bp = new Boxplot();

$bp->setData($data)
   ->create('img/BasicUsage.png');
-
结果
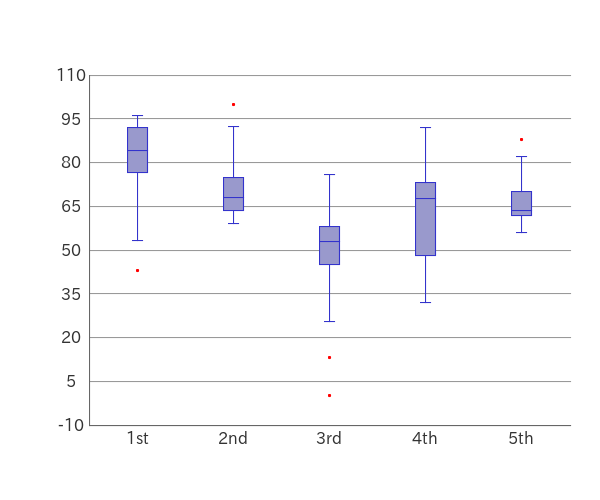
Outlier Detection默认开启。Outliers以红色点表示。Scale Range大于Data Range10%。- 水平网格线以
Scale Range的 10% 为间隔绘制。 - 数据的关键字用作 X 轴的标签。
-
详细信息
- 导入自动加载器:
require_once __DIR__ . '/../vendor/autoload.php' - 声明:
use Macocci7\PhpBoxplot\Boxplot - 实例化:
new Boxplot() - 设置数据:
setData($data)- 可接受的数据类型:
array<int|string, array<int|float>>
- 可接受的数据类型:
- 创建图像:
create($path)
- 导入自动加载器:

5.2. 通过方法调整显示
调整缩放大小、网格间距、显示垂直网格、
设置每个箱型图的标签、X 轴标签、Y 轴标签
并设置标题可以按如下方式完成
-
PHP
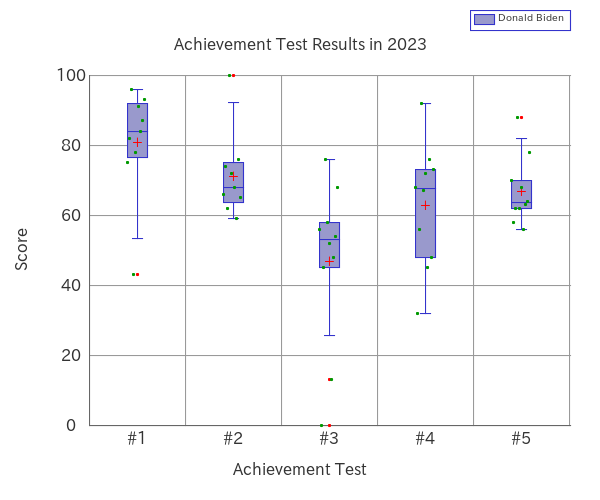
<?php

require_once __DIR__ . '/../vendor/autoload.php';

use Macocci7\PhpBoxplot\Boxplot;

$data = [
    '1st' => [ 75, 82, 96, 43, 78, 91, 84, 87, 93, ],
    '2nd' => [ 66, 74, 62, 100, 72, 68, 59, 76, 65, ],
    '3rd' => [ 56, 0, 45, 76, 58, 52, 13, 48, 54, 68, ],
    '4th' => [ 68, 32, 56, 92, 67, 72, 45, 76, 48, 73, ],
    '5th' => [ 70, 58, 62, 88, 62, 68, 56, 63, 64, 78, ],
];

$bp = new Boxplot();

$bp->setData($data)
   ->limit(0, 100)
   ->gridHeightPitch(20)
   ->gridVerticalOn()
   ->meanOn()
   ->jitterOn()
   ->legendOn()
   ->labels([ '#1', '#2', '#3', '#4', '#5', ])
   ->labelX('Achievement Test')
   ->labelY('Score')
   ->caption('Achievement Test Results in 2023')
   ->legends(['Donald Biden'])
   ->create('img/AdjustDisplayByMethods.png');
-
结果
-
详细信息
-
设置限制:
limit(int|float $lower, int|float $upper) -
设置网格间距:
gridHeightPitch(int|float $pitch) -
设置垂直网格可见性
gridVerticalOn()gridVerticalOff()
-
设置标签:
labels(string[] $labels) -
设置 X 轴标签:
labelX(string $labelX) -
设置 Y 轴标签:
labelY(string $labelY) -
设置标题:
caption(string $caption) -
可用方法
注意:
$colorCode必须是#RGB或#RRGGBB格式。
-

5.3. 多个数据集
可以同时显示多个数据集。
-
PHP: examples/MultipleDataSet.php
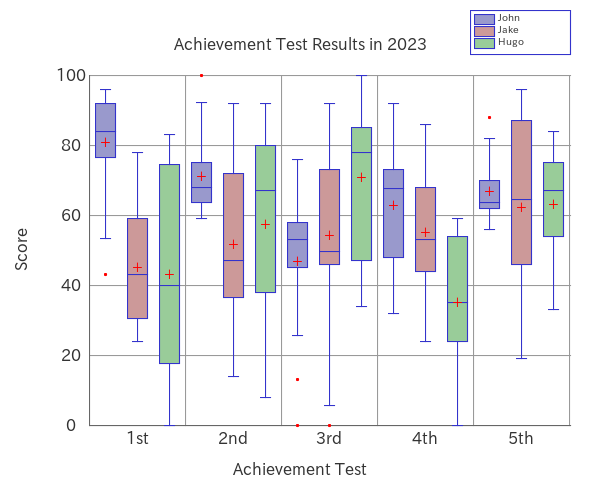
<?php

require_once __DIR__ . '/../vendor/autoload.php';

use Macocci7\PhpBoxplot\Boxplot;

$dataSet = [
    'John' => [
        '1st' => [75, 82, 96, 43, 78, 91, 84, 87, 93, ],
        '2nd' => [66, 74, 62, 100, 72, 68, 59, 76, 65, ],
        '3rd' => [56, 0, 45, 76, 58, 52, 13, 48, 54, 68, ],
        '4th' => [68, 32, 56, 92, 67, 72, 45, 76, 48, 73, ],
        '5th' => [70, 58, 62, 88, 62, 68, 56, 63, 64, 78, ],
    ],
    'Jake' => [
        'test#1' => [62, 35, 48, 43, 56, 78, 32, 24, 29, ],
        'test#2' => [37, 92, 56, 36, 14, 86, 41, 58, 47, ],
        'test#3' => [49, 83, 0, 48, 64, 73, 50, 46, 38, 92, ],
        'test#4' => [53, 44, 34, 51, 74, 68, 53, 86, 24, 66, ],
        'test#5' => [83, 61, 55, 96, 87, 46, 21, 19, 88, 68, ],
    ],
    'Hugo' => [
        'test01' => [73, 36, 0, 11, 40, 76, 24, 46, 83, ],
        'test02' => [69, 42, 76, 8, 92, 84, 45, 34, 67, ],
        'test03' => [100, 46, 34, 77, 85, 47, 91, 85, 66, 79, ],
        'test04' => [0, 14, 32, 24, 54, 44, 56, 32, 59, 38, ],
        'test05' => [69, 84, 65, 42, 33, 80, 74, 54, 75, 56, ],
    ],
];

$bp = new Boxplot();
$bp->setDataset($dataSet)
   ->limit(0, 100)
   ->gridHeightPitch(20)
   ->gridVerticalOn()
   ->legendOn()
   ->meanOn()
   ->labelX('Achievement Test')
   ->labelY('Score')
   ->caption('Achievement Test Results in 2023')
   ->create('img/MultipleDataSet.png');
-
结果: examples/img/MultipleDataSet.png
-
详细信息
- 设置数据集:
setDataset(array $dataSet)$dataSet:array<int|string, array<int|string, array<int|float>>>
array_keys($dataSet)的结果将设置为图例。- 在这种情况下: [ 'John', 'Jake', 'Hugo', ] 将设置为图例。
array_keys($dataSet[array_keys($dataSet)[0]])的结果将设置为标签。- 在这种情况下: [ '1st', '2nd', '3rd', '4th', '5th', ] 将设置为图例。
legends(array $legends)可以覆盖图例。labels(array $labels)可以覆盖标签。
- 设置数据集:

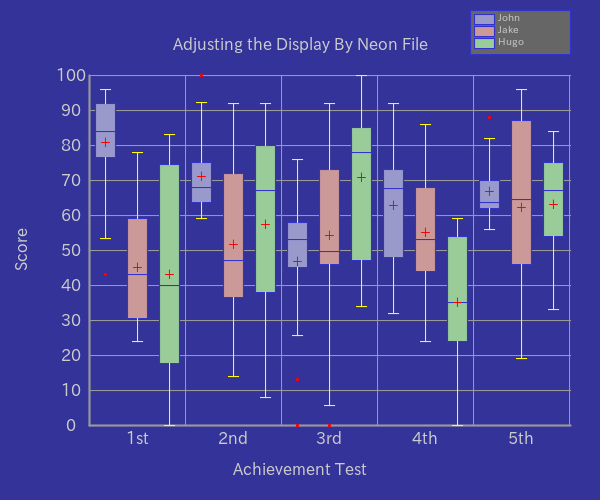
5.4. 通过 Neon 文件调整显示
您可以使用 Neon 文件调整显示。
首先,准备一个类似下面的 Neon 文件
-
Neon: examples/AdjustDisplayByNeon.neon
# Configuration for BoxplotExample.php

dataSet:
    'John': [
        1st: [75, 82, 96, 43, 78, 91, 84, 87, 93]
        2nd: [66, 74, 62, 100, 72, 68, 59, 76, 65]
        3rd: [56, 0, 45, 76, 58, 52, 13, 48, 54, 68]
        4th: [68, 32, 56, 92, 67, 72, 45, 76, 48, 73]
        5th: [70, 58, 62, 88, 62, 68, 56, 63, 64, 78]
    ]
    'Jake': [
        'test#1': [62, 35, 48, 43, 56, 78, 32, 24, 29]
        'test#2': [37, 92, 56, 36, 14, 86, 41, 58, 47]
        'test#3': [49, 83, 0, 48, 64, 73, 50, 46, 38, 92]
        'test#4': [53, 44, 34, 51, 74, 68, 53, 86, 24, 66]
        'test#5': [83, 61, 55, 96, 87, 46, 21, 19, 88, 68]
    ]
    'Hugo': [
        'test01': [73, 36, 0, 11, 40, 76, 24, 46, 83]
        'test02': [69, 42, 76, 8, 92, 84, 45, 34, 67]
        'test03': [100, 46, 34, 77, 85, 47, 91, 85, 66, 79]
        'test04': [0, 14, 32, 24, 54, 44, 56, 32, 59, 38]
        'test05': [69, 84, 65, 42, 33, 80, 74, 54, 75, 56]
    ]

limitUpper: 100
limitLower: 0

#canvasWidth: 600
#canvasHeight: 400
canvasBackgroundColor: '#333399'
#frameXRatio: 0.7
#frameYRatio: 0.6

axisColor: '#999999'
axisWidth: 2

#gridColor: '#cccccc'
#gridWidth: 1

gridHeightPitch: 10
gridVertical: true

#boxWidth: 20
#boxBackgroundColors:
#    - '#9999cc'
#    - '#cc9999'
#    - '#99cc99'
#    - '#99cccc'
#    - '#cc6666'
#    - '#ffcc99'
#    - '#cccc99'
#    - '#cc99cc'
#boxBorderColor: '#3333cc'
#boxBorderWidth: 1

whiskerColor: '#ffff00'
#whiskerWidth: 1

#fontPath: 'fonts/ipaexg.ttf' # IPA ex Gothic 00401
#fontSize: 16
fontColor: '#cccccc'

outlier: true
#outlierDiameter: 2
#outlierColor: '#ff0000'

#jitter: true
#jitterColor: '#009900'
#jitterDiameter: 2

mean: true
#meanColor: '#ff0000'

#labels: [ '1st', '2nd', '3rd', '4th', '5th' ]
labelX: 'Achievement Test'
labelY: 'Score'
caption: 'Adjusting the Display By Neon File'

legend: true
legendBackgroundColor: '#666666'
#legends: [ 'John', 'Jake', 'Hugo', ]
legendWidth: 100
legendFontSize: 10

# Default Color Set
#colors:
#    - '#9999cc'
#    - '#cc9999'
#    - '#99cc99'
#    - '#99cccc'
#    - '#cc6666'
#    - '#ffcc99'
#    - '#cccc99'
#    - '#cc99cc'
其次,编写如下PHP代码
-
PHP: examples/AdjustDisplayByNeon.php
<?php

require_once __DIR__ . '/../vendor/autoload.php';

use Macocci7\PhpBoxplot\Boxplot;

$bp = new Boxplot();
$bp->config('AdjustDisplayByNeon.neon')
   ->create('img/AdjustDisplayByNeon.png');
然后,运行PHP代码。
5.5. 通过数组调整显示
您可以使用数组来调整显示。
-
PHP: examples/AdjustDisplayByArray.php
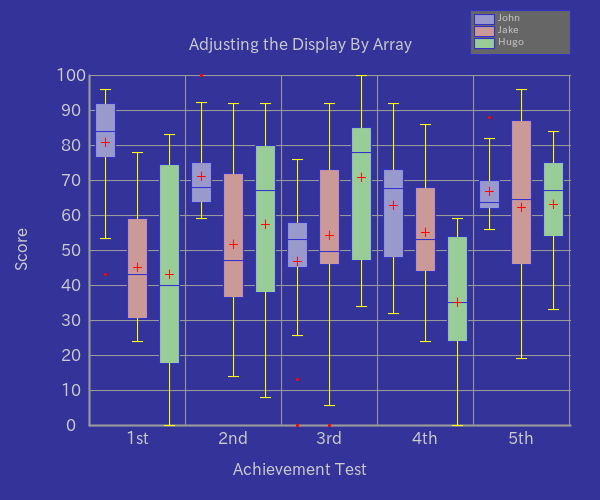
<?php

require_once __DIR__ . '/../vendor/autoload.php';

use Macocci7\PhpBoxplot\Boxplot;

$conf = [
    'dataSet' => [
        'John' => [
            '1st' => [75, 82, 96, 43, 78, 91, 84, 87, 93, ],
            '2nd' => [66, 74, 62, 100, 72, 68, 59, 76, 65, ],
            '3rd' => [56, 0, 45, 76, 58, 52, 13, 48, 54, 68, ],
            '4th' => [68, 32, 56, 92, 67, 72, 45, 76, 48, 73, ],
            '5th' => [70, 58, 62, 88, 62, 68, 56, 63, 64, 78, ],
        ],
        'Jake' => [
            'test#1' => [62, 35, 48, 43, 56, 78, 32, 24, 29, ],
            'test#2' => [37, 92, 56, 36, 14, 86, 41, 58, 47, ],
            'test#3' => [49, 83, 0, 48, 64, 73, 50, 46, 38, 92, ],
            'test#4' => [53, 44, 34, 51, 74, 68, 53, 86, 24, 66, ],
            'test#5' => [83, 61, 55, 96, 87, 46, 21, 19, 88, 68, ],
        ],
        'Hugo' => [
            'test01' => [73, 36, 0, 11, 40, 76, 24, 46, 83, ],
            'test02' => [69, 42, 76, 8, 92, 84, 45, 34, 67, ],
            'test03' => [100, 46, 34, 77, 85, 47, 91, 85, 66, 79, ],
            'test04' => [0, 14, 32, 24, 54, 44, 56, 32, 59, 38, ],
            'test05' => [69, 84, 65, 42, 33, 80, 74, 54, 75, 56, ],
        ],
    ],
    'limitUpper' => 100,
    'limitLower' => 0,
    'canvasBackgroundColor' => '#333399',
    'axisColor' => '#999999',
    'axisWidth' => 2,
    'gridHeightPitch' => 10,
    'gridVertical' => true,
    'whiskerColor' => '#ffff00',
    'fontColor' => '#cccccc',
    'outlier' => true,
    'mean' => true,
    'labelX' => 'Achievement Test',
    'labelY' => 'Score',
    'caption' => 'Adjusting the Display By Array',
    'legend' => true,
    'legendBackgroundColor' => '#666666',
    'legendWidth' => 100,
    'legendFontSize' => 10,
];

$bp = new Boxplot();
$bp->config($conf)
   ->create('img/AdjustDisplayByArray.png');
-
结果: examples/img/AdjustDisplayByArray.png

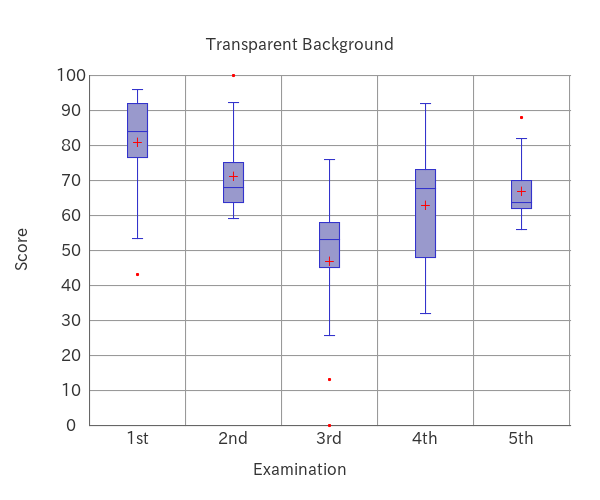
5.6. 透明背景
您可以设置透明背景如下。
-
PHP: examples/TransparentBackground.php
<?php

require_once __DIR__ . '/../vendor/autoload.php';

use Macocci7\PhpBoxplot\Boxplot;

$data = [
    '1st' => [75, 82, 96, 43, 78, 91, 84, 87, 93],
    '2nd' => [66, 74, 62, 100, 72, 68, 59, 76, 65],
    '3rd' => [56, 0, 45, 76, 58, 52, 13, 48, 54, 68],
    '4th' => [68, 32, 56, 92, 67, 72, 45, 76, 48, 73],
    '5th' => [70, 58, 62, 88, 62, 68, 56, 63, 64, 78],
];

$bp = new Boxplot();

$bp->setData($data)
   ->config([
    // This results in Transparent Background
    'canvasBackgroundColor' => null,
])
   ->limit(0, 100)
   ->gridHeightPitch(10)
   ->gridVerticalOn()
   ->outlierOn()
   ->meanOn()
   ->labelX('Examination')
   ->labelY('Score')
   ->caption('Transparent Background')
   ->create('img/TransparentBackground.png');
-
结果: examples/img/TransparentBackground.png
示例
-
BasicUsage.php >> 结果为
-
AdjustDisplayByMethods.php >> 结果为
-
AdjustDisplayByNeon.php >> 结果为
-
AdjustDisplayByArray.php >> 结果为
-
MultipleDataSet.php >> 结果为
-
TransparentBackground.php >> 结果为
-
DetmersReidBoxplot2023.php >> 结果为
-
BoxplotExampleCase.php >> 结果为

许可证
文档创建日期:2023/05/28
文档更新日期:2024/04/18
版权所有 2023 - 2024 macocci7