brocode / module-chartee
使用 chart.js 生成图表的模块
Requires
- league/csv: ^9.8
- magento/framework: *
README
本模块旨在简化在 Magento 2 中创建强大图表的过程。它基于 chart.js 库(它本身也已被 Magento2 用于其仪表板图表)和各种扩展以支持额外的图表类型。
本模块的目标
- 独立于 Magento 的版本管理和其库依赖的更新(仅当前 2.4.7-beta2 使用 chart.js v4.4.0!)并在旧版 Magento2 安装中使用较新的 chart.js 版本
- 提供一种简单的方法,在 Magento2 中创建图表,无需深入了解 chart.js 库本身
- 提供样板代码,以便轻松将任何类型的图表集成到 Magento 中的各个位置
- 鼓励大家创建已有数据的合理表示,否则任何利益相关者都不会看到,因为它被埋藏在数据库中
安装
composer require brocode/module-chartee
bin/magento module:enable BroCode_Chartee
bin/magento setup:upgrade
功能
支持的图表类型
柱状图 基于 https://www.chartjs3.com/docs/chart/getting-started/ 的基本实现

堆叠柱状图
通过 chart.js 插件 https://github.com/y-takey/chartjs-plugin-stacked100/ 实现的柱状图变体 
极坐标图
基于 https://codepen.io/FranciscusAgnew/pen/LRGPYX 的示例实现的极坐标图 
饼图
基于 https://www.youtube.com/watch?v=YcRj52VovYQ 的基本饼图的变体 
仪表盘图
基于 https://www.youtube.com/watch?v=VF6jd2Fv4bs&list=RDCMUCojXvfr41NqDxaPb9amu8-A&index=1 的饼图变体 
箱线图
什么是箱线图?更多信息请参阅 维基百科。
基于 https://www.youtube.com/watch?v=2zEbeX0bPS8 的箱线图 
可用的图表
客户群体分布
该图表显示了注册客户在不同客户群体中的分布情况。它还提供了将显示的数据作为 CSV 下载的可能性。
可以在页面 客户 -> 客户组 中找到:[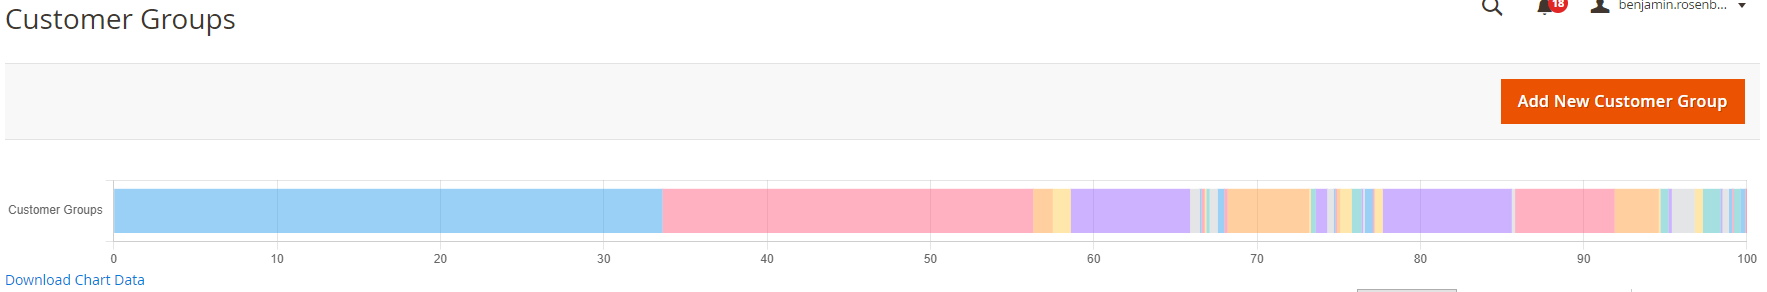](https://github.com/brosenberger/module-chartee/blob/HEAD//docs/customergroup_distribution_chart.png "客户组分布")
权限:只有具有权限 BroCode_Chartee::chart_customer_group_distribution 的管理员用户才能查看图表。[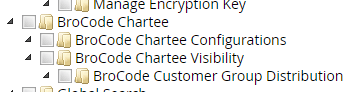](https://github.com/brosenberger/module-chartee/blob/HEAD//docs/acl_configuration.png "客户组分布权限")
配置: 商店 -> 配置 -> 服务 -> Chartee 报告配置 -> 客户报告设置
- 可以通过配置禁用图表
- 可以通过配置更改下载文件名。[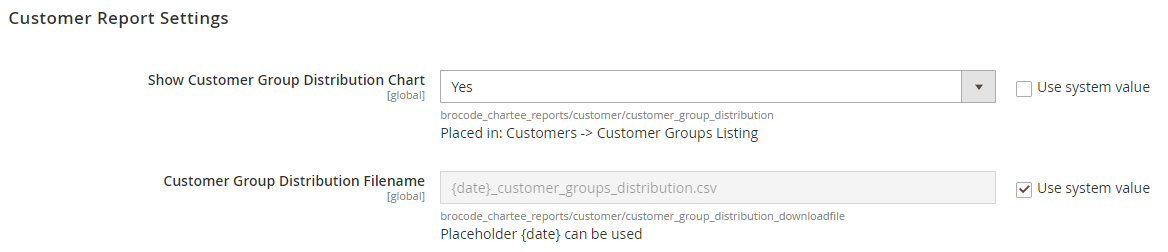](https://github.com/brosenberger/module-chartee/blob/HEAD//docs/customer_chart_configuration.png "客户组分布配置")
Adminhtml 菜单项
所有菜单都可以在 内容 -> BroCode Chartee 下找到。[](https://github.com/brosenberger/module-chartee/blob/HEAD//docs/menu_items.png "Adminhtml 菜单项")
Chartbuilder 列表
显示所有注册的图表构建器。

目前没有实现更多功能。可能的功能包括
- 生成的 chart.js 配置的预览(待定)
演示图表
列出所有当前演示图表以及它们在 js 侧的实现链接。
样板代码片段
ColumnBaseChart
一个简单的基类,用于在列布局中排列所有添加的子块。它根据是否显示图表动态设置所需的列(这可以根据配置或权限而变化)。此外,还添加了一个部分标题。
一个包含 2 列和部分标题的行的示例
<block name="dashboard.chart.row.1" class="BroCode\Chartee\Block\ColumnBaseChart">
    <action method="setData">
        <argument name="name" xsi:type="string">section_title</argument>
        <argument name="value" xsi:type="string">First Section Title</argument>
    </action>
    <block name="dashboard.chart.row.1.chart.1" ...>...</block>
    <block name="dashboard.chart.row.1.chart.2" ...>...</block>
</block>
BaseCompositeChart
基本图表显示类。它可以在前端和 Adminhtml 中使用(存在一个专门的子类,用于检查后端权限:BroCode\Chartee\Block\Adminhtml\BaseCompositeChartsBlock)。它提供以下功能
- 根据配置值检查可见性
- 添加准备显示数据(或更多)的下载链接的功能,作为 CSV 文件
- 可以配置下载文件名(否则将自动生成为 {当前日期}_{md5 哈希}.csv)
- 应可下载的图表构建器数据的关键
- 根据 ACL 权限检查可见性(仅限 Adminhtml 类)
<block name="brocode.customer.customergroup.distribution.chart" template="BroCode_Chartee::customer/customer_group_distribution.phtml" class="BroCode\Chartee\Block\Adminhtml\BaseCompositeChartsBlock">
    <action method="setData">
        <argument name="name" xsi:type="string">visibilityConfigPath</argument>
        <argument name="value" xsi:type="string">brocode_chartee_reports/customer/customer_group_distribution</argument>
    </action>
    <action method="setData">
        <argument name="name" xsi:type="string">permission</argument>
        <argument name="value" xsi:type="string">BroCode_Chartee::chart_customer_group_distribution</argument>
    </action>
    <action method="setData">
        <argument name="name" xsi:type="string">chartDataBuilder</argument>
        <argument name="value" xsi:type="string">brocode-customer-stacked-group</argument>
    </action>
    <action method="setData">
        <argument name="name" xsi:type="string">downloadNameConfigPath</argument>
        <argument name="value" xsi:type="string">brocode_chartee_reports/customer/customer_group_distribution_downloadfile</argument>
    </action>
    <action method="setData">
        <argument name="name" xsi:type="string">downloadDataKey</argument>
        <argument name="value" xsi:type="string">customer_groups_data</argument>
    </action>
</block>
图表数据构建器
每个图表都需要一个数据源,这是一个 \BroCode\Chartee\Api\ChartDataBuilderInterface 的实现。对于每个基本图表,已经实现了一个单独的数据构建器,并带有该类型图表的默认配置以及创建所需配置的可能附加方法。
每个基本图表都有自己的默认数据构建器和在 \BroCode\Chartee\Model\DataBuilder\Demo 中的实现示例。
实现新的数据构建器
扩展所需的具体 ChartDataBuilder,这里是一个 DemoPolarChartDataBuilder 的示例
class DemoPolarChartDataBuilder extends PolarChartDataBuilder
{
    public function build()
    {
        $this->setDataLabels(['Mon', 'Tue', 'Wed', 'Thu', 'Fri', 'Sat', 'Sun'])
            ->createDataSet()
                ->setLabel('Weekly Sales')
                ->setDataValues(12, 19, 3, 17, 28, 24, 7)
                ->setBackgroundColors("#2ecc71", "#3498db", "#95a5a6", "#9b59b6", "#f1c40f", "#e74c3c", "#34495e")
                ->build();

        return parent::build();
    }
}
要添加用于下载的数据,必须单独将任何数据设置到图表构建器类
public function build()
{
    ...
    $this->setData('customer_groups_data', $groupData);
    ...
    return parent::build();
}
在数据构建器服务中进行注册
数据构建器需要在 di.xml 中进行注册,以便在模板块类中使用它作为命名构建器
<?xml version="1.0"?>
<config xmlns:xsi="http://www.w3.org/2001/XMLSchema-instance"
        xsi:noNamespaceSchemaLocation="urn:magento:framework:ObjectManager/etc/config.xsd">

    <type name="\BroCode\Chartee\Model\ChartDataService">
        <arguments>
            <argument name="chartDataBuilders" xsi:type="array">
                <item name="brocode-customer-stacked-group" xsi:type="object">\BroCode\Chartee\Model\DataBuilder\Customer\StackedCustomerGroupDataBuilder</item>
            </argument>
        </arguments>
    </type>
</config>
数据筛选
\BroCode\Chartee\Model\ChartRequestParameterService 提供了收集在构建所需数据时应考虑的所有设置筛选参数的方法。
当前支持以下参数
- 范围(ChartRequestParameterService::getStoreIds(),基于后端商店切换器 Magento\Backend\Block\Store\Switcher)
- 日期范围(ChartRequestParameterService::getStartDate() & ChartRequestParameterService::getEndDate(),未设置时为 null)
提示:在您的后端页面上添加商店筛选器
<?xml version="1.0"?>
<page xmlns:xsi="http://www.w3.org/2001/XMLSchema-instance"
      xsi:noNamespaceSchemaLocation="urn:magento:framework:View/Layout/etc/page_configuration.xsd">

<body>
    <referenceContainer name="page.main.actions">
        <block class="Magento\Backend\Block\Store\Switcher" name="store_switcher" as="store_switcher" template="Magento_Backend::store/switcher.phtml">
            <action method="setUseConfirm">
                <argument name="params" xsi:type="string">0</argument>
            </action>
            <action method="setSwitchWebsites">
                <argument name="params" xsi:type="string">1</argument>
            </action>
            <action method="setSwitchStoreGroups">
                <argument name="params" xsi:type="string">1</argument>
            </action>
        </block>
    </referenceContainer>
</body>
提示:在您的后端页面上添加日期范围筛选器
<?xml version="1.0"?>
<page xmlns:xsi="http://www.w3.org/2001/XMLSchema-instance"
xsi:noNamespaceSchemaLocation="urn:magento:framework:View/Layout/etc/page_configuration.xsd">

    <body>
        <referenceContainer name="page.main.actions">
            <block class="BroCode\Chartee\Block\Filter\DateRangePicker" name="date_range_picker" />
        </referenceContainer>
    </body>
</page>
提示:在自定义元素中使用日期范围选择器
<input type="text" name="daterange" value="" data-mage-init='{"date-range-picker": {}}'/>
配置可能性提示(见https://www.daterangepicker.com/#config),例如隐藏周数
<input type="text" name="daterange" value="" data-mage-init='{"date-range-picker": {"showWeekNumbers":false}}'/>
BroCode\Chartee\Block\Widget\BaseChart
这些图表由BaseCompositeChart类使用,也可以作为独立图表使用。相应的示例页面图表就是这样实现的。
添加新图表的步骤
- 创建一个数据构建器(见上面)
- 创建一个虚拟类型并为该数据构建器定义一个特定的视图模型
<virtualType name="BroCode\Chartee\Block\ViewModel\DemoBoxplotChartConfiguration" type="BroCode\Chartee\Block\ViewModel\BaseChartDataViewModel">
    <arguments>
        <argument name="dataBuilder" xsi:type="object">BroCode\Chartee\Model\DataBuilder\Demo\DemoBoxplotDataBuilder</argument>
    </arguments>
</virtualType>
- 创建一个布局更新并设置定义的视图模型
<block class="BroCode\Chartee\Block\Widget\BaseChart" name="chartee.boxplot.demo.chart">
    <action method="setViewModel">
        <argument name="viewModel" xsi:type="object">
            BroCode\Chartee\Block\ViewModel\DemoBoxplotChartConfiguration
        </argument>
    </action>
</block>
JS库,Chart.js版本和扩展
- chart.js v4.4.0
- chart.js辅助工具(其部分)v4.3.2
- chart.js boxplot插件v4.2.4
- chart.js stacked100插件v1.5.2
- chart.js autocolors插件0.2.2
- 基于互联网上的示例的自定义实现(见上面参考资料)在graph.js中
- 圆形图表标签线插件
- 仪表图
- JQuery daterangepicker扩展 https://github.com/dangrossman/daterangepicker